Accredited official statistics
Summary - Company Insolvency Statistics January to March 2021
Published 30 April 2021

© Crown copyright 2021
This publication is licensed under the terms of the Open Government Licence v3.0 except where otherwise stated. To view this licence, visit nationalarchives.gov.uk/doc/open-government-licence/version/3 or write to the Information Policy Team, The National Archives, Kew, London TW9 4DU, or email: psi@nationalarchives.gov.uk.
Where we have identified any third party copyright information you will need to obtain permission from the copyright holders concerned.
This publication is available at https://www.gov.uk/government/statistics/company-insolvency-statistics-january-to-march-2021/summary-company-insolvency-statistics-january-to-march-2021
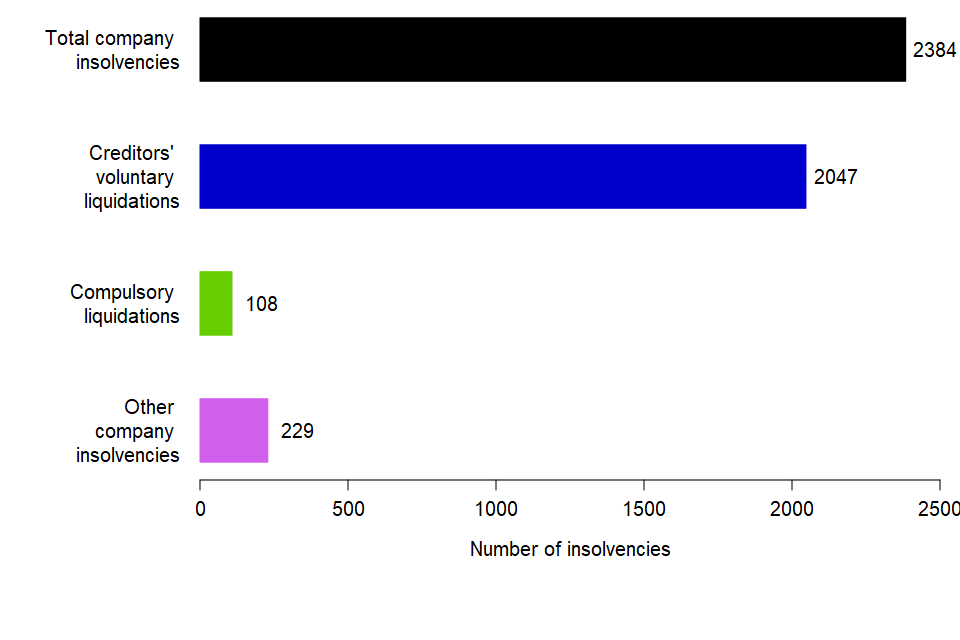
Total company insolvencies in England & Wales decreased by 22% from Q4 2020 to 2,384 in Q1 2021:
| 2021 Q1 | % change from Q4 2020 | |
|---|---|---|
| Total company insolvencies | 2,384 | -22% |
| Creditors’ voluntary liquidations | 2,047 | -18% |
| Compulsory liquidations | 108 | -26% |
| Other company insolvencies | 229 | -46% |
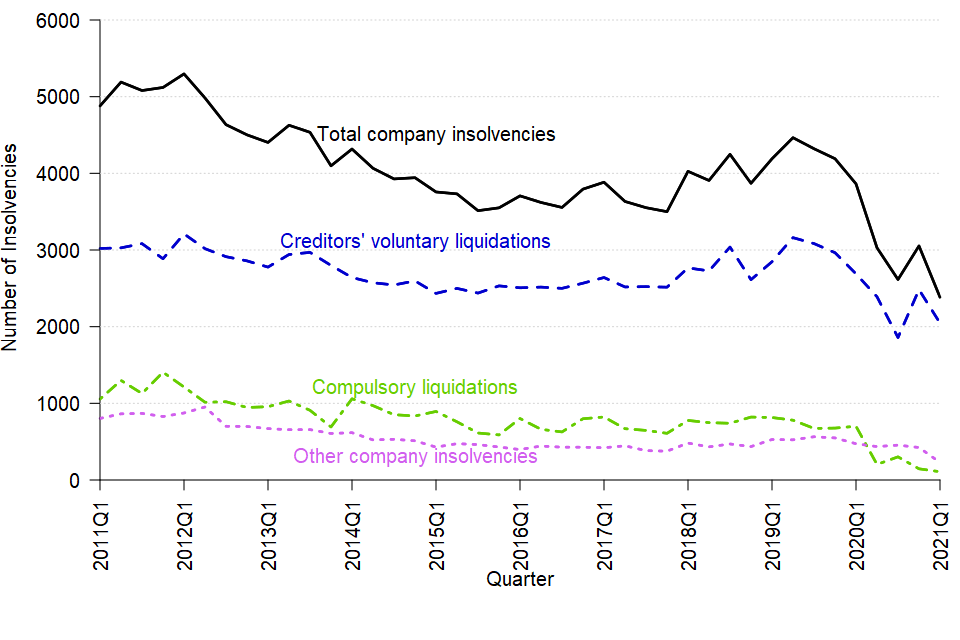
Company insolvencies remain lower than pre-pandemic levels
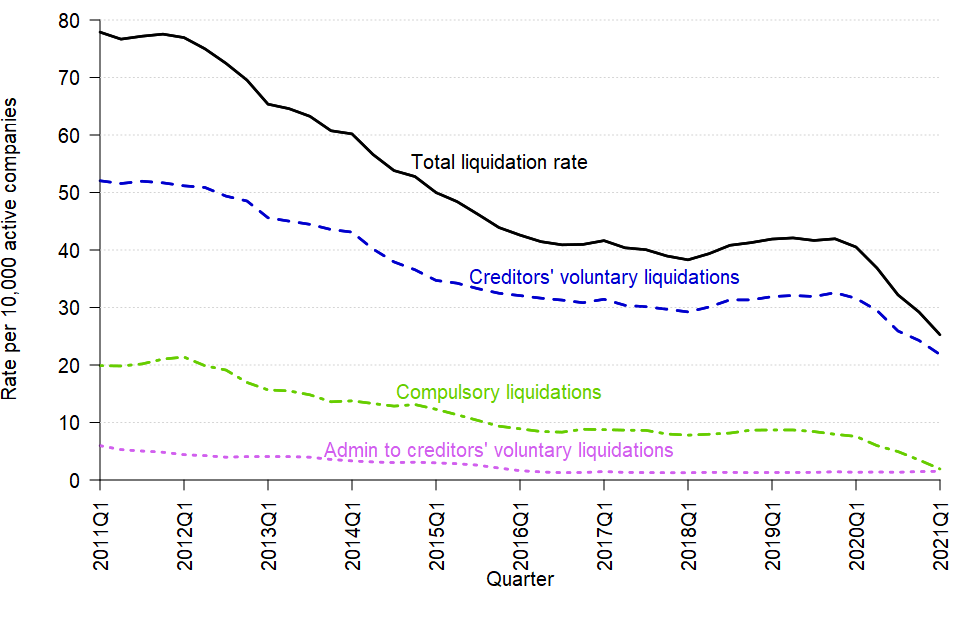
The liquidation rate per 10,000 active companies also fell