Main report for the Participation Survey (May 2023 to March 2024)
Updated 13 February 2025
Applies to England

© Crown copyright 2025
This publication is licensed under the terms of the Open Government Licence v3.0 except where otherwise stated. To view this licence, visit nationalarchives.gov.uk/doc/open-government-licence/version/3 or write to the Information Policy Team, The National Archives, Kew, London TW9 4DU, or email: psi@nationalarchives.gov.uk.
Where we have identified any third party copyright information you will need to obtain permission from the copyright holders concerned.
This publication is available at https://www.gov.uk/government/statistics/participation-survey-2023-24-annual-publication/main-report-for-the-participation-survey-may-2023-to-march-2024
February 2025 - A small number of figures have had revisions due to a minor processing error. The corresponding data tables and this report have been updated. We expect we may make a small number of similar minor revisions at the end of March, but not to any of our headline indicators.
1. Background
- Released: 24th July 2024
- Geographical Coverage: England
This release provides estimates on engagement in the digital, culture, media, and live sport sectors reported during the period of May 2023 to March 2024 (2023/24). The Participation Survey is a nationally representative annual survey of adults (16+) in England that aims to track the latest trends in engagement in DCMS, Arts Councils England (ACE), and digital sectors[footnote 1]. The format of the survey is push-to-web, with a paper version for those who are not able or wish not to complete this online.
This report presents the headline estimates during May 2023 to March 2024, and demographic breakdowns[footnote 2] of adults who have engaged in the specific sectors covered in the survey. Further estimates can be found in the accompanying data tables. Differences between groups are only reported on in this publication where they are statistically significant, that is, where we can be more confident that the differences seen in our sampled respondents reflect the population[footnote 3]. Estimates for the final quarter of 2023/24 (January to March 2024) have also been published in a separate set of data tables, alongside the first three quarters of the survey year.
It should be noted that most questions in the survey ask about engagement with cultural and digital activities in the last 12 months (such that it covered the period May 2022 to March 2024). Comparisons of this year’s 2023/24 results are made against the previous year 2022/23 (covering the period of April 2022 to March 2023).
In 2023/24, DCMS partnered with ACE to boost the Participation Survey to be able to produce meaningful estimates at Local Authority level. This has enabled us to have the most granular data we have ever had. It also means there are some new questions and changes to existing questions, response options and definitions in the 2023/24 survey.
Where there has been a change, we have highlighted where a comparison with previous data can or cannot be made. Questionnaire changes can affect results, and therefore should be taken into consideration when interpreting the findings.
2. Arts
Examples of physical arts engagement include reading, performing music, or going to a comedy event. Examples of digital arts engagement include watching live-streamed or recorded theatre, participating in live visual arts programs, or listening to pre-recorded music or dance events. The full list of qualifying activities[footnote 4] and events we asked about are in Annex 3, and shown in Figures 2.4 and 2.5. All estimates in this chapter (excluding the grey box below) are based on DCMS’ definition of the arts sector, as outlined in Annex 3.
Headline findings
During May 2023 to March 2024 (2023/24): 91% of adults engaged with the arts at least once in the last 12 months, a 1 percentage point increase from 2022/23 (90%).
Figure 2.1 shows that 90% of adults had engaged with the arts physically in the previous 12 months before being surveyed, a 1 percentage point increase from 2022/23 (89%). The corresponding figure for digital engagement was 36%, an 8 percentage point increase from 2022/23 (28%).
Figure 2.1: Engagement with the arts sector, England: 2022/23 – 2023/24 (Base: All adults).

Figure 2.2 shows that of the 91% of adults who engaged with the arts, 55% of adults engaged exclusively physically, whilst 35% engaged both physically and digitally and only 1% engaged exclusively digitally.
Figure 2.2: Physical and digital engagement with the arts sector, England: 2023/24 (Base: All adults)

Figure 2.3 shows that of those who engaged with the arts physically, the most frequent level[footnote 5] at which adults attended any arts event or participated in any arts activity was once a week (59%). Whereas, of those who digitally engaged with the arts the most frequent level at which adults engaged with the arts sector online was three to four times a year (33%).
Figure 2.3: Most frequent level of physical and digital engagement with the arts sector, England: 2023/24 (Base: Adults who physically or digitally engaged with the arts)

Figure 2.4 shows that the most popular way to engage with the arts physically was reading books or magazines (64%). This was followed by cinema screening of a film or movie (55%) and a theatrical performance (39%).
Figure 2.4: Form of physical engagement with the arts sector, England: 2023/24 (Base: All adults)

Figure 2.5 shows that for digital engagement, watching a pre-recorded music or dance event was the most popular (21%). Around 17% of adults reported that they watched a live music or dance event as it was happening, whilst 10% of adults reported that they watched a pre-recorded arts event including theatre, visual arts or literature. This was similar to the previous year (2022/23).
Figure 2.5: Forms of digital engagement with the arts sector, England: 2023/24 (Base: All adults)

Of those who did engage digitally with the arts, nearly half of respondents (49%) said ‘content is paid for through TV licence fee’ and 46% said they accessed ‘free content’. Nearly a quarter (24%) of adults paid ‘a monthly or annual subscription’. Only 2% reported they accessed ‘paid content for free, using other methods’ and similarly only 2% reported they accessed ‘content using a log-in belonging to someone not in their household’.
Attendance, participation or watching arts events or activities covered by ACE’s policy remit
Arts Council England (ACE) is the national development agency for creativity and culture. They invest in artists, arts organisations, museums and libraries, and provide development opportunities for this sector[footnote 6]. As part of our partnership with ACE, we have published additional estimates for the proportion of adults who attended, participated in or watched arts events or activities covered by ACE’s policy remit. Options within the survey which would fall within this remit include:
Attendance:
- An exhibition of art, photography or sculptures
- A theatre play, drama, musical, Pantomime, Ballet or Opera
- An event connected with literature, books, reading, poetry reading or writing
- A craft exhibition
- A live music event
- An arts festival and or carnival
- A street art event
- A live dance event
Participation:
- Written stories, plays, or poetry
- Written, practised or performed music
- Painting, drawing, printmaking, calligraphy, colouring
- Crafts
- Choreographed or performed a drama or dance routine
- Photography as a hobby
Watched online:
- A live arts event including theatre, visual arts or literature
- A pre-recorded arts event including theatre, visual arts or literature
- A live music or dance event, watched as it was happening
- A pre-recorded music or dance event
In 2023/24, 78% of adults attended an art event in person, or participated in an art activity in person, or watched online an arts event covered by ACE’s policy remit, in the last 12 months. Of which:
- 65% of adults attended an art event in person in the last 12 months.
- 45% of adults participated in an art activity in person in the last 12 months.
- 36% of adults watched an art event online in the last 12 months.[footnote 7]
Further data is published in the accompanying datasets.
Who engaged with the arts?[footnote 8]
Figure 2.6 shows that in 2023/24:
-
Age: There was some variation in how people of different ages physically engaged with the arts. For example, adults aged 85 and over (86%) were less likely to engage with the arts physically than adults from all other age classifications presented here. Similarly for digital engagement, there was also some variation, for example adults aged 85 and over (29%) were less likely to engage with the arts digitally than adults from all other age classifications presented here.
-
Disability Status: For both physical and digital engagement with the arts, there were no differences observed between disabled adults and non-disabled adults.
Figure 2.6: Physical and digital engagement with the arts sector, by age and disability status, England: 2023/24 (Base: All adults)

Figure 2.7 shows that in 2023/24:
- Sex: Female adults (92%) were more likely to engage with the arts physically than male adults (89%). There were no differences in the level of digital engagement with the art sector by sex.
- Gender identity: For both physical and digital engagement with the arts, there were no differences observed between adults whose gender identity was the same as their sex registered at birth and adults who reported that their gender identity was different from their sex registered at birth.
- Sexual Orientation: Heterosexual or straight adults (91%) and adults in the “other” sexual orientation classification (90%) engaged less with the arts physically than gay or lesbian adults (95%) or bisexual adults (96%). Heterosexual or straight adults (36%) engaged the least with the arts digitally than all other sexual orientation classifications presented here (43–45%).
Figure 2.7: Physical and digital engagement with the arts sector, by sex[footnote 9], gender identity[footnote 10] and sexual orientation[footnote 11], England: 2023/24 (Base: All adults)

Figure 2.8 shows that:
- Religion: There was a lot of variation in how adults from different religious groups engaged with the arts. For example, Muslim adults (75%) engaged the least physically with the arts than adults from all other religious groups presented here (86–94%). Similarly, for digital engagement, Muslim adults (25%) engaged the least digitally with the arts than adults from all other religious groups presented here (31–47%).
- Ethnicity: There was a lot of variation in how adults from different ethnic groups engaged with the arts. For example, adults from the Pakistani ethnic group (73%) engaged less with the arts physically than all other ethnic groups presented here with the exception of adults from the Bangladeshi (77%), Arab (78%) or Gypsy or Irish Traveller ethnic group (80%). For digital arts engagement, similarly adults from the Pakistani ethnic group (22%) engaged less than all other ethnic groups presented here (30–47%), with the exception of adults from the Bangladeshi ethnic group (23%).
Figure 2.8: Physical and digital engagement with the arts sector, by religion and ethnicity, England: 2023/24 (Base: All adults)

| Bar label | Ethnicity | Bar label | Ethnicity | Bar label | Ethnicity |
|---|---|---|---|---|---|
| A | Bangladeshi | G | Caribbean | M | Arab |
| B | Chinese | H | Any other black, African, or Caribbean background | N | Any other ethnic group |
| C | Indian | I | Mixed white and Asian | O | English, Welsh, Scottish, Northern Irish, or British |
| D | Pakistani | J | Mixed white and black African | P | Gypsy or Irish Traveller |
| E | Any other Asian background | K | Mixed white and black Caribbean | Q | Irish |
| F | African | L | Any other multi-ethnic background | R | Any other white background |
Figure 2.9 shows that:
- Socio-economic classification: There was some variation in both physical and digital engagement in the arts for adults of different socio-economic classifications. For example, for both physical and digital engagement in the arts, adults from the higher managerial, administrative and professional occupations classification (96% and 41%) engaged with the arts more than adults from all other socio-economic classifications presented here. Whilst adults from the never worked and long-term unemployed classification physically engaged with the arts (76% and 29%) less than adults from all other socio-economic classifications presented here.
- Index of Multiple Deprivation (IMD): There was some variation in both physical and digital engagement in the arts for adults in different deprivation deciles. For example, adults from the highest decile (the least deprived) (95%) engaged the most with the arts physically compared to adults from all other deciles (82–94%), whilst adults from the lowest decile (the most deprived) (82%) engaged the least with the arts physically compared to adults from all other deciles (86–94%). Similarly for digital engagement, adults from the lowest decile (the most deprived) (30%) engaged the least with the arts digitally compared to adults from all other deciles (34–40%).
Figure 2.9: Physical and digital engagement with the arts sector, by socio-economic classification[footnote 12] and Index of Multiple Deprivation[footnote 13], England: 2023/24 (Base: All adults)

| Bar label | Socio-Economic Classification |
|---|---|
| A | Higher managerial, administrative, and professional occupations |
| B | Intermediate occupations |
| C | Routine and manual occupations |
| D | Never worked and long-term unemployed |
Geographical findings
Figure 2.10 shows that there was a high proportion of physical engagement with the arts sector for adults of all regions, varying from 93% for adults in the South East and South West to 89% for adults in the North East, North West, West Midlands and the Yorkshire and the Humber regions.Of 296 LAs, 62% are not significantly different to the England average, with 24% above and 14% below, although some of these differences are small but significant. In general, the patterns of engagement at the regional level are also observed at the local authority (LA) level.
Some of the local authorities where physical art engagement was highest were in Chichester, South Cambridgeshire, City of London and Rutland (97%). Some of the local authorities where physical art engagement was lowest were in Leicester (80%), Slough (81%) and Blackburn with Darwen (81%).
Figure 2.10: Physical engagement with the arts sector, by Local Authority[footnote 14][footnote 15], England: 2023/24 (Base: All adults)
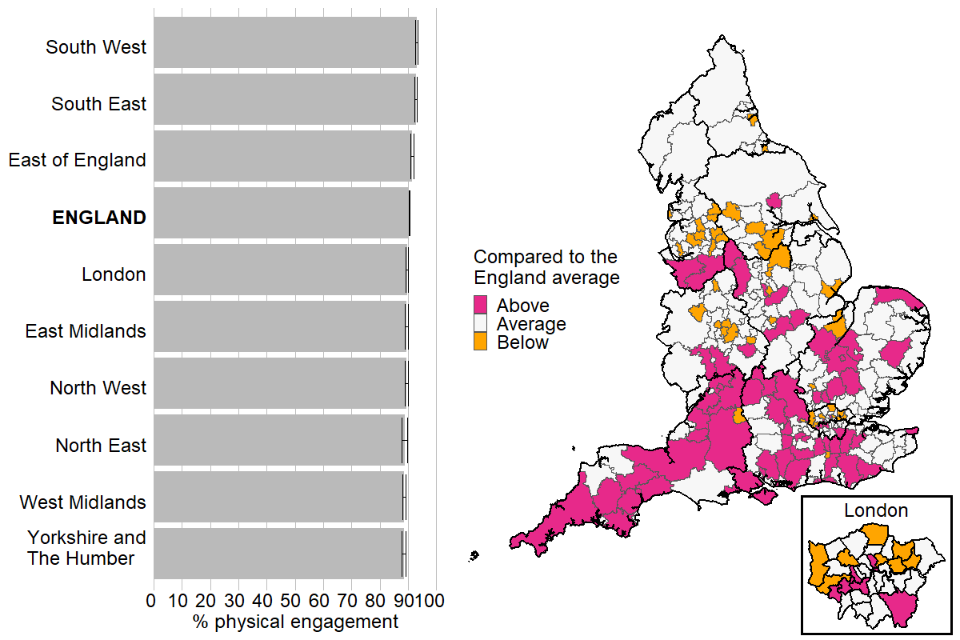
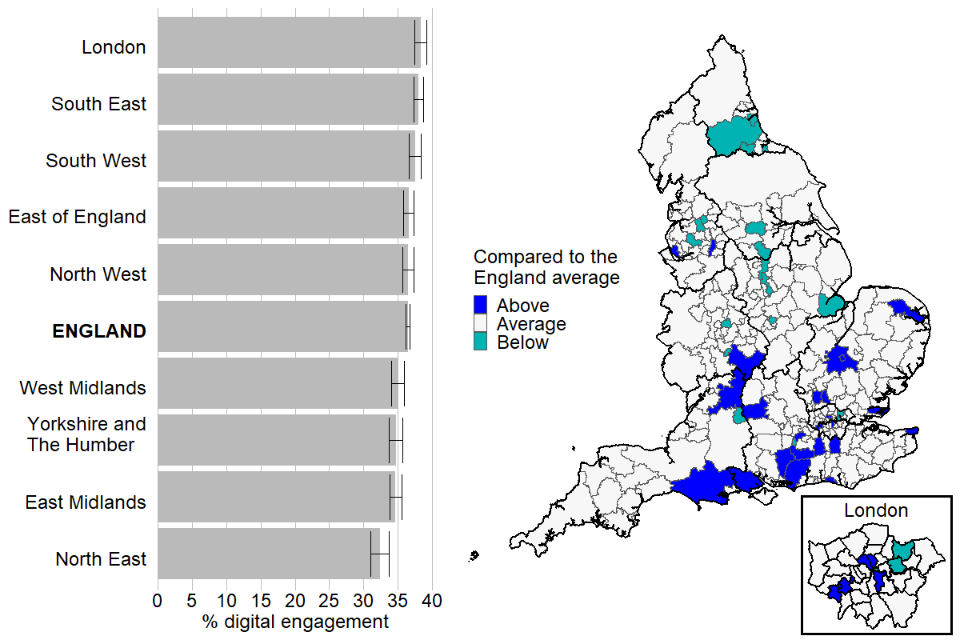
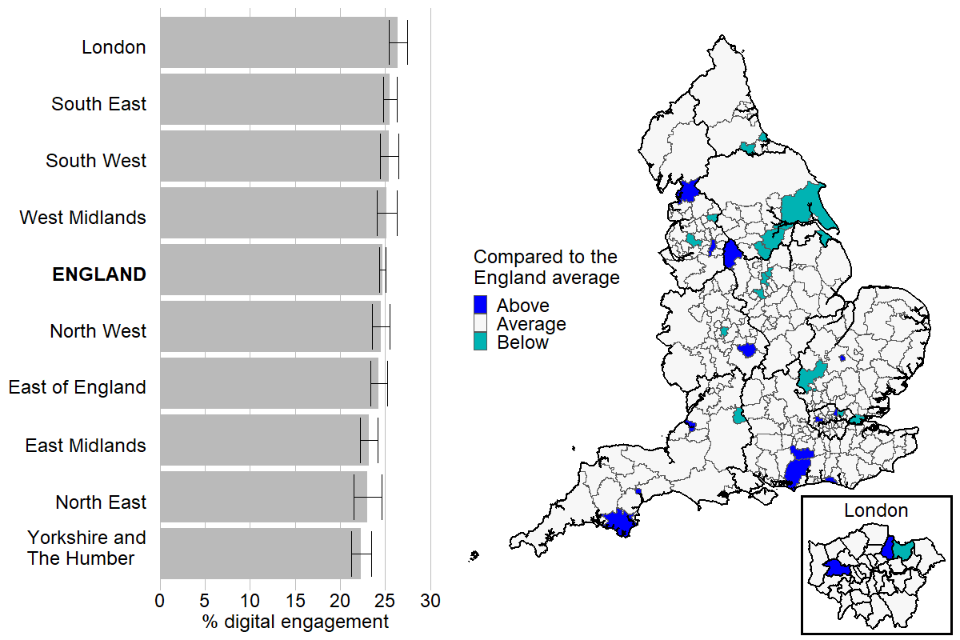
Figure 2.11 shows that adults in London (38%) and the South East (38%) regions digitally engaged with the arts more than the England average (36%), whilst adults in the South West (37%) engaged slightly more. Adults in the North East (32%) region digitally engaged with the arts less than the England average, whilst adults in the West Midlands (35%), Yorkshire and the Humber (35%) and East Midlands (35%) regions engaged slightly less .Of 296 LAs, 84% are not significantly different to the England average, with 9% above and 7% below, although some of these differences are small but significant. In general, the patterns of usage at the regional level are also observed at the local authority (LA) level. There are however some exceptions:
- In London (38%) and South East (38%) regions where digital engagement with the arts were above the England average, City of London (25%), Newham (30%), Redbridge (29%) and Rushmoor (31%) local authorities were lower than the average.
- In the West Midlands (35%) region where digital engagement with the arts was slightly lower than the England average, Stratford-on-Avon (43%) local authority was higher than the average.
Figure 2.11: Digital engagement with the arts sector, arts sector, by Local Authority[footnote 14][footnote 15], England: 2023/24 (Base: All adults)
Barriers to engagement
Respondents who did not engage with the arts were asked why they did not. The most common reasons given are shown in Figure 2.12 and were:
- For physical engagement, ‘No reason in particular’’ (28%) and ‘I’m not interested in cultural or arts activities’ (24%) were the most common barriers cited for not engaging with the arts sector.
- For digital engagement – ‘No reason in particular’ (41%) and ‘I cannot afford it’ (20%) were most commonly identified as barriers to engaging with the arts sector.
Figure 2.12: Reasons for not physically or digitally engaging with the arts sector, England: 2023/24 (Base: Adults who did not engage with the arts)

3. Libraries
Physical library engagement includes visiting a public library building or mobile library in-person during leisure time, being visited by a home library service and using another library outreach services (for example attending a community event where the library staff or volunteers were present). Digital engagement with libraries could include survey respondents using their online catalogue, paying fees online, or borrowing e-books and downloading audiobooks. The full list of included activities[footnote 4] we asked in the survey are in Annex 3 and shown in Figures 3.5 and 3.6.
Headline findings
During May 2023 to March 2024 (2023/24): 3 in 10 (30%) of adults engaged with the libraries at least once in the last 12 months, a 4 percentage point increase from 2022/23 (26%).
Figure 3.1 shows that 25% of adults had engaged with libraries physically in the previous 12 months to being surveyed, a 6 percentage point increase from 2022/23 (19%). The corresponding figure for digital engagement was 14%, a 1 percentage point increase from 2022/23 (13%).
Figure 3.1: Engagement with the libraries sector, England: 2022/23 – 2023/24 (Base: All adults)

Figure 3.2 shows that of the 30% of adults who engaged with the libraries, 16% of adults engaged exclusively physically, whilst 9% engaged both physically and digitally and only 5% engaged exclusively digitally.
Figure 3.2: Physical and digital engagement with the libraries sector, England: 2023/24 (Base: All adults)

Figure 3.3 shows that of those who engaged with the libraries physically, the most frequent level at which adults attended any library event or participated in any library activity was three to four times a year (34%). Similarly of those who digitally engaged with the libraries, the most frequent level[footnote 16] at which adults engaged with the libraries sector online was three to four times a year (31%).
Figure 3.3: Most frequent level of physical and digital engagement with the libraries sector, England: 2023/24 (Base: Adults who physically or digitally engaged with libraries)

Figure 3.4 shows that the most popular activities to do whilst physically engaging with libraries was ‘browsing, borrowing, and returning reading and media materials’(60%) and ‘‘Took a child to borrow, browse or return books’ (27%). This was followed by ‘Used free Wi-Fi, computer or printing facilities’ (23%) and ‘Used the library as a study space’ (19%). This was similar to the previous year (2022/23).
Figure 3.4: Activities done whilst visiting a public or mobile library in person, England: 2023/24 (Base: Adults who physically engaged with libraries)

Figure 3.5 shows that for digital engagement ‘Reserved or renewed books or paid a fine’ was the most popular (48%) activity, followed by ‘Searched online catalogues or dictionaries or made an enquiry’ or ‘Borrowed digital or online resources’, both 44%. This was similar to the previous year (2022/23).
Figure 3.5: Activities done when engaging online with the libraries sector, England: 2023/24 (Base: Adults who digitally engaged with libraries)

Who engaged with libraries ?[footnote 8]
Figure 3.6 shows that in 2023/24:
- Age: There was a lot of variation in how people of different ages physically or digitally engaged with libraries. For instance, 50–54 year old adults (19%) and 55–59 year old adults (18%) physically engaged with libraries less than all other age groups presented here (21–33%). For digital engagement, 16–19 year olds (23%) digitally engaged with libraries more than than all other age groups presented here (7–19%), whilst the adults aged 85 or older (7%) digitally engaged less than all other age groups presented here (9–23%).
- Disability Status: Non-disabled adults (26%) were more likely to physically engage with libraries than disabled adults (24%). Similarly for digital engagement, non-disabled adults (15%) were more likely to digitally engage with libraries than disabled adults (13%).
Figure 3.6: Physical and digital engagement with the libraries sector, by age and disability status, England: 2023/24 (Base: All adults)

Figure 3.7 shows that in 2023/24:
- Sex: Female adults (28%) were more likely to physically engage with libraries than male adults (22%). There was a similar pattern for digital engagement, as female adults (15%) were more likely to digitally engage with libraries than male adults (13%).
- Gender identity: Adults who reported that their gender identity was different from their sex registered at birth (31%) physically engaged with libraries more than adults whose gender identity was the same as their sex registered at birth (25%). This was a similar pattern for digital engagement, where 14% of adults whose gender identity was the same as their sex registered at birth digitally engaged with the libraries, whilst 25% of adults who reported that their gender identity was different from their sex registered at birth digitally engaged with the libraries.
- Sexual Orientation: Bisexual adults (34%) and adults in the “other” sexual orientation classification (35%) were more likely to physically engage with the arts than heterosexual or straight adults (25%) or gay or lesbian adults (24%). For digital engagement, adults in the “other” sexual orientation classification (34%) engaged more than all other sexual orientation classifications presented here. Whilst, heterosexual or straight adults (14%) digitally engaged with libraries less than all other sexual orientation classifications presented here. Bisexual adults (25%) digitally engaged with libraries more than gay or lesbian adults (17%). There were no other differences between the classifications presented here for library engagement.
Figure 3.7: Physical and digital engagement with the libraries sector, by sex[footnote 9], gender identity[footnote 10] and sexual orientation[footnote 11], England: 2023/24 (Base: All adults)

Figure 3.8 shows that:
- Religion: Non-religious adults (24%) engaged less physically with the libraries sector than adults from all other religious groups presented here (25–35%). Christian adults (25%) were less likely to physically engage with libraries than adults from all other religious groups presented here (29–35%) with the exception of non-religious adults. For digital engagement with libraries, Christian adults (13%) were less likely to engage with libraries than adults from all other religious groups presented here (14–26%). Non-religious adults (14%) were also less likely to digitally engage with libraries than all other religious groups presented here with the exception of Christian adults. Adults from the ‘any other’ religious group (34%) engaged less than all other religious groups presented here with exception of non-religious adults or Christian adults. There were no other differences between the classifications presented here for library engagement.
- Ethnicity: There was a lot of variation in how adults from different ethnic groups engaged with libraries either physically or digitally. For instance, white British adults[footnote 17] were less likely to physically (23%) or digitally (12%) engage with libraries than all other ethnic groups presented here.
Figure 3.8: Physical and digital engagement with the libraries sector, by religion and ethnicity, England: 2023/24.

| Bar label | Ethnicity | Bar label | Ethnicity | Bar label | Ethnicity |
|---|---|---|---|---|---|
| A | Bangladeshi | G | Caribbean | M | Arab |
| B | Chinese | H | Any other black, African, or Caribbean background | N | Any other ethnic group |
| C | Indian | I | Mixed white and Asian | O | English, Welsh, Scottish, Northern Irish, or British |
| D | Pakistani | J | Mixed white and black African | P | Gypsy or Irish Traveller |
| E | Any other Asian background | K | Mixed white and black Caribbean | Q | Irish |
| F | African | L | Any other multi-ethnic background | R | Any other white background |
Figure 3.9 shows that:
-
Socio-economic classification: There was some variation in both physical and digital engagement in the libraries for adults of different socio-economic classifications. For example, for both physical and digital engagement with libraries, adults from the higher managerial, administrative and professional occupations classification (28% and 16%) engaged with libraries more than adults from all other socio-economic classifications presented here, whilst adults from routine and manual occupations (19% and 10%) engaged less with libraries than all from all other socio-economic classifications presented here.
-
Index of Multiple Deprivation (IMD): There was some variation in both physical and digital engagement with libraries for adults in different deprivation deciles. For example, adults from the highest decile (the least deprived) (29%) engaged the most with libraries physically compared to adults from all other deciles (23–26%). For digital engagement, adults from the highest decile (the least deprived) (16%) engaged slightly more digitally with libraries compared to adults from all other deciles (13-15%), with the exception of adults from the 3rd or 4th decile (both 15%).
Figure 3.9: Physical and digital engagement with the libraries sector, by socio-economic classification[footnote 12] and Index of Multiple Deprivation[footnote 13], England: 2023/24 (Base: All adults)

| Bar label | Socio-Economic Classification |
|---|---|
| A | Higher managerial, administrative, and professional occupations |
| B | Intermediate occupations |
| C | Routine and manual occupations |
| D | Never worked and long-term unemployed |
Geographical findings
Figure 3.10 shows that compared with the England average, adults in the London (30%) region physically engaged with libraries more, whilst adults in the West Midlands (23%), Yorkshire and the Humber (22%), East Midlands (22%) and the North East (20%) regions physically engaged with libraries less than the England average (25%). Of 296 LAs, 63% are not significantly different to the England average, with 17% above and 20% below, although some of these differences are small but significant. In general, the patterns of usage at the regional level are also observed at the local authority (LA) level. There are however some exceptions:
- In the South East (27%) region where physical engagement with libraries was higher than the England average, Ashford (19%), Buckinghamshire (21%) and Maidstone (18%) local authorities were lower than the average.
- In the West Midlands (23%) region where physical engagement with libraries was lower than the England average, Malvern Hills (32%), Warwick (32%) and Worcester (33%) local authorities were higher than the average.
- In the East Midlands (22%) region where physical engagement with libraries was lower than England average, Rushcliffe (35%) and Rutland (31%) local authorities were higher than the average.
- In Yorkshire and the Humber (22%) region where physical engagement with libraries was lower than the England average, York (31%) local authority was higher than the average.
Figure 3.10: Physical engagement with the libraries sector, by Local Authority[footnote 14][footnote 15], England: 2023/24 (Base: All adults)
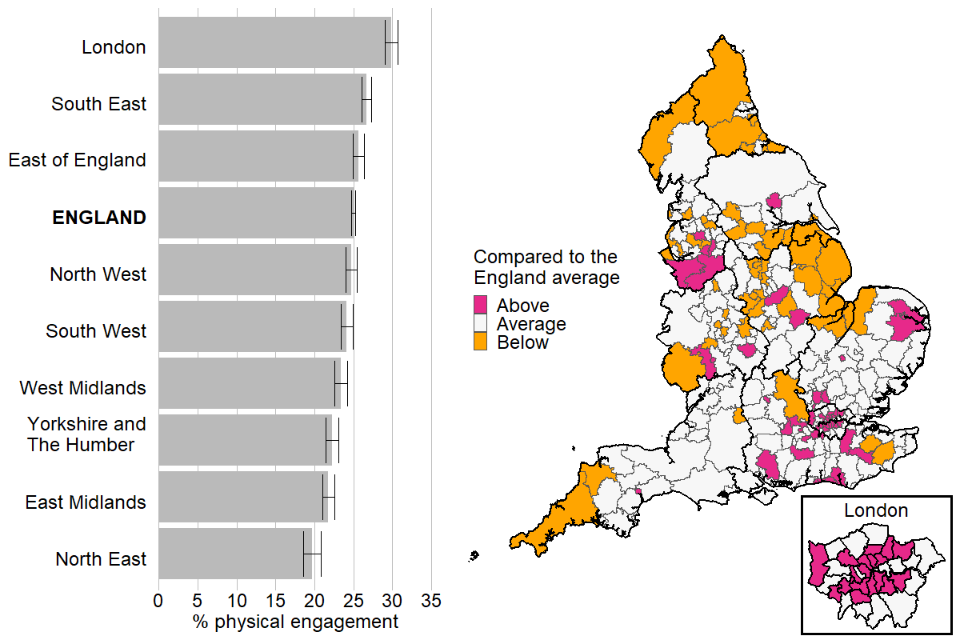
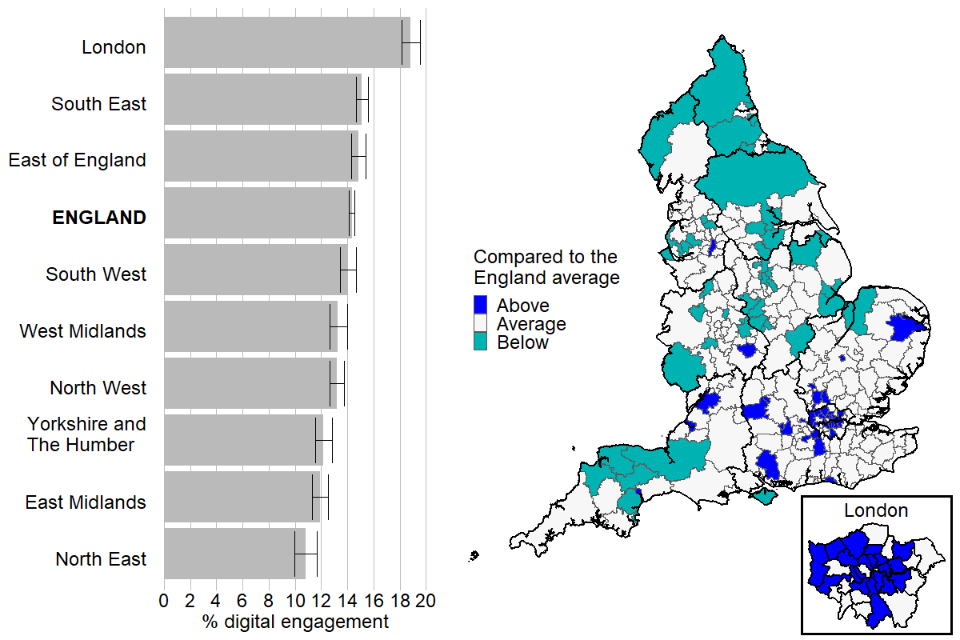
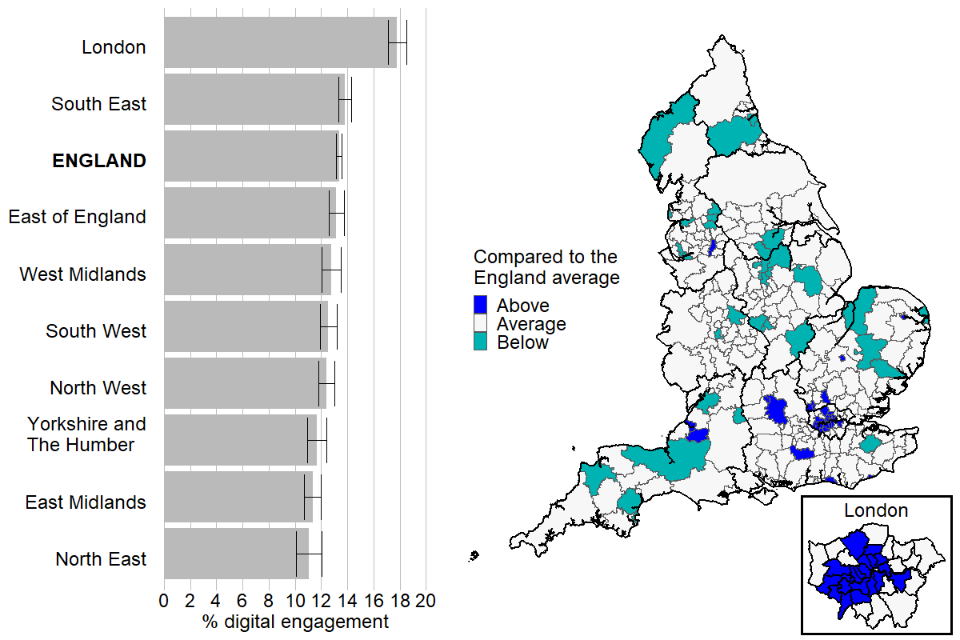
Figure 3.11 shows that similarly to physical engagement with libraries, compared with the England average, adults in London (19%) digitally engaged with libraries more, whilst adults in the South East (15%) digitally engaged with libraries slightly more than the England average (14%). Adults in the West Midlands (13%) and North West (13%) regions digitally engaged with libraries slightly less than the England average, whilst adults in Yorkshire and the Humber (12%), East Midlands (12%) and the North East (11%) regions digitally engaged with libraries less than the England average. In general, the patterns of usage at the regional areas are also observed at the local authority (LA) level. Of 296 LAs, 70% are within the England average, with 14% above and 16% below, although some of these differences are small but significant. There are however some exceptions:
- In the South East (15%) region where digital engagement with libraries was slightly higher than England’s average, the Isle of Wight (7%) local authority was lower than the average.
- In the North West (13%) region where digital engagement with libraries was lower than England’s average, Manchester (22%) local authority was above the average .
- In the West Midlands (13%) region where digital engagement with libraries was slightly lower than England’s average, Warwick (19%) local authority was above the average .
Figure 3.11: Digital engagement with the libraries sector, by Local Authority[footnote 14][footnote 15], England: 2023/24 (Base: All adults)
Barriers to engagement
Respondents who did not engage with the libraries were asked why they did not. The most common reasons given are shown in Figure 3.12 and were:
- For physical engagement – ‘I don’t need to use library services’ (33%) and ‘I’m not interested’ (27%) were the most common barriers cited for not engaging with libraries.
- For digital engagement – ‘I’m not interested’ (28%) and ‘I don’t need to use library services’ (27%) were most commonly identified as barriers to engaging with libraries.
Figure 3.12: Reasons for not physically or digitally engaging with the libraries sector, England: 2023/24 (Base: Adults who did not engage with libraries)

4. Heritage
Physical engagement with the heritage sector is defined as visiting one of a variety of places with celebrated histories, such as those connected with industrial history, or ancient monuments, or archaeological sites. Digital engagement with the heritage sector includes taking a virtual tour of any of those physical locations listed in Figure 4.3, plus viewing documents from an archive in England online, or researching local history online. The full list of qualifying heritage activities[footnote 4] we asked about are in Annex 3 and shown in Figures 4.4 and 4.6.
Note, the total heritage engagement (physical or digital) figure and figure for engaging in heritage both physically and digitally are only available for quarters 3 and 4, due to an error in the survey set-up where the physical heritage questions were asked to one subset of respondents, whilst the digital heritage questions were asked to a different subset of respondents in the prior quarters. This error was rectified for quarter 3 and quarter 4. Thus, the estimates for “physically OR digitally” and “physically AND digitally” were calculated using the quarter 3 and quarter 4 data only. Other measures of heritage engagement in either mode are based on all four quarters.
Headline findings
During May 2023 to March 2024 (2023/24): 69%
of adults reported having engaged with the heritage sector in the last 12 months[footnote 18], no change from 2022/23 (69%), as shown in Figure 4.1.
Figure 4.1: Total engagement with the heritage sector (physically or digitally)[footnote 19], England: 2022/23 – 2023/24 (Base: All adults)

Figure 4.2 shows that 66% of adults had visited a heritage site physically in the previous 12 months to being surveyed, a 1 percentage point decrease from 2022/23 (67%). The corresponding figure for digital engagement was 25%, a 7 percentage point increase from 2022/23 (18%)[footnote 20].
Figure 4.2: Physical engagement and digital engagement with the heritage sector[footnote 19], England: 2022/23 – 2023/24 (Base: All adults)

Figure 4.3 shows that of those who engaged with the heritage sector, the most frequent level[footnote 21] was three to four times a year (around 38% for physical and 36% digital).
Figure 4.3: Most frequent level of physical and digital engagement with the heritage sector, England: 2023/24 (Base: Adults who physically or digitally engaged with heritage sector from subsample of approximately a third of online respondents)

Figure 4.4 shows that the most popular heritage activities were visiting:
- Parks or garden with historic or artistic features (40%)
- A city or town with celebrated historic nature (37%)
- A historic landscape or habitat (37%)
Figure 4.4: Forms of physical engagement with the heritage sector, England: 2023/24 (Base: All adults)

Figure 4.5 shows that the top cited reason for engaging with the heritage sector physically was “To spend time with family or friends” (57%), followed by “General interest in the heritage site” (52%). Furthermore, 33% of adults reported that they engaged with heritage sites because “It was in the area”.
Figure 4.5: Reasons for visiting heritage sites, England: 2023/24 (Base: Adults who physically engaged with heritage sector from subsample of approximately a third of online respondents)

Figure 4.6 shows that the digital heritage activity that most adults engaged with was something not in the list given (75%). From the list given, “Researched your local history online” was the most popular (14%).
Figure 4.6: Forms of digital engagement with the heritage sector, England: 2023/24 (Base: All adults)

Respondents were asked how they usually paid for digital heritage content. Of those who did engage digitally with heritage, the most common response was “Access content using a log-in belonging to someone NOT in my household” (69%), followed by “Access free content” (15%)
Who engaged with the heritage sector?[footnote 8]
Figure 4.7 shows that in 2023/24:
- Age:There was a lot of variation in how people of different ages physically or digitally engaged with the heritage sector. For example, 65 to 74 year old adults (74%) physically engaged with the heritage sector more than all other age groups presented here (45–70%). Adults aged 85 or above were less engaged physically (45%) or digitally (15%) with the heritage sector compared to all other age groups presented here.
- Disability Status: Non-disabled adults (70%) were more likely to physically engage with the heritage sector than disabled adults (60%). For digital engagement with the heritage sector, there were no differences observed between adults of different disability status.
Figure 4.7: Physical and digital engagement with the heritage sector, by age and disability status, England: 2023/24 (Base: All adults)

Figure 4.8 shows that in 2023/24:
- Sex: There were no differences in the level of physical engagement with the heritage sector by sex. However, male adults (27%) digitally engaged with the heritage sector more than female adults (22%).
- Gender identity: For physical engagement with the heritage sector, there were no differences observed between adults whose gender identity was the same as their sex registered at birth and adults who reported that their gender identity was different from their sex registered at birth. However, for digital engagement, adults who reported that their gender identity was different from their sex registered at birth (30%) engaged digitally with the heritage sector more than adults whose gender identity was the same as their sex registered at birth (25%) .
- Sexual Orientation: Heterosexual or straight adults (66%) physically engaged with the heritage sector less than all other sexual orientation classifications presented here (69–73%). Similarly for digital engagement, heterosexual or straight adults (24%) physically engaged with the heritage sector less than all other sexual orientation classifications presented here (32–38%). Adults in the “other” sexual orientation classification (38%) digitally engaged more than gay or lesbian adults (32%). There were no other differences between the sexual orientation classifications presented here for engagement with the heritage sector.
Figure 4.8: Physical and digital engagement with the heritage sector, by sex[footnote 9], gender identity[footnote 10] and sexual orientation[footnote 11], England: 2023/24 (Base: All adults)

Figure 4.9 shows that:
- Religion: There was some variation in how adults from different religious groups engaged with the heritage sector. For example, Muslim adults (49%) or Sikh adults (50%) physically engaged the least with the heritage sector than all other religious groups presented here (64–78%). Whereas, Buddhist adults (76%), Jewish adults (74%) or adults from the ‘any other’ religious group classification (78%) physically engaged the most with the heritage sector compared to all other religious groups presented here (49–69%). For digital engagement, for instance, Non-religious adults (24%) digitally engaged less with the heritage sector compared to all other religious groups presented here, with the exception of Muslim adults (25%), Sikh adults (26%) or Christian adults (25%).
- Ethnicity: There was a lot of variation in how adults from different ethnic groups engaged with the heritage sector. For instance, adults from any other white background (74%) physically engaged with the heritage sector more than white British adults[footnote 17] (68%). Whereas for digital engagement, adults from the white and Asian ethnic group (32%) engaged more with heritage than white British adults[footnote 17] (24%).
Figure 4.9: Physical and digital engagement with the heritage sector, by religion and ethnicity, England: 2023/24 (Base: All adults)

| Bar label | Ethnicity | Bar label | Ethnicity | Bar label | Ethnicity |
|---|---|---|---|---|---|
| A | Bangladeshi | G | Caribbean | M | Arab |
| B | Chinese | H | Any other black, African, or Caribbean background | N | Any other ethnic group |
| C | Indian | I | Mixed white and Asian | O | English, Welsh, Scottish, Northern Irish, or British |
| D | Pakistani | J | Mixed white and black African | P | Gypsy or Irish Traveller |
| E | Any other Asian background | K | Mixed white and black Caribbean | Q | Irish |
| F | African | L | Any other multi-ethnic background | R | Any other white background |
Figure 4.10 shows that:
- Socio-economic classification: There was some variation in both physical and digital engagement in the heritage sector for adults of different socio-economic classifications. For example, adults from the higher managerial, administrative and professional occupations classification engaged physically (76%) and digitally (29%) with the heritage sector more than adults from all other socio-economic classifications presented here. Adults from the never worked and long-term unemployed classification engaged (47%) less physically with the heritage sector than adults from all other socio-economic classifications presented here (57–76%). Adults from the never worked and long-term unemployed classification engaged digitally (23%) slightly more with the heritage sector than adults from the intermediate occupations classification (22%) or adults from routine and manual occupations classifications (21%).
- Index of Multiple Deprivation (IMD): There was some variation in how adults from different deprivation deciles physically engaged with the heritage sector. Generally, as deprivation decreased, physical engagement in the heritage sector increased, with adults from the lowest decile (the most deprived) engaging physically with the heritage sector the least (51%) compared to adults from all other deciles presented here (55–76%). The highest three deciles, 8th, 9th and 10th decile engaged more (73%,74% and 76% respectively) than all other deciles presented here (51–71%). For digital engagement, the most deprived decile (22%) engaged less than adults from all deciles except for the second and seventh decile (24%).
Figure 4.10: Physical and digital engagement with the heritage sector, by socio-economic classification[footnote 12] and Index of Multiple Deprivation[footnote 13], England: 2023/24 (Base: All adults)

| Bar label | Socio-Economic Classification |
|---|---|
| A | Higher managerial, administrative, and professional occupations |
| B | Intermediate occupations |
| C | Routine and manual occupations |
| D | Never worked and long-term unemployed |
Geographical findings
Figure 4.11 shows that, compared with the England average, adults in the South East (70%) and South West (72%) regions physically engaged with heritage more, whilst adults in the West Midlands (62%) and North West (63%) regions physically engaged with heritage less than the England average (66%). Of 296 LAs, 66% are not significantly different to the England average, with 18% above and 16% below, although some of these differences are small but significant. In general, the patterns of usage at the regional level are also observed at the local authority (LA) level. However, there are a few exceptions:
- In the South East (70%) region where physical engagement with heritage was higher than the England average, Dartford (58%), Milton Keynes (60%) and Slough (54%) local authorities were lower than the average.
- In the West Midlands (62%) region where physical engagement with heritage was lower than the England average, Shropshire (78%), Stratford-on-Avon (78%), Warwick (76%) and Wychavon (74%) local authorities were higher than the average.
- In the North West (63%) region where physical engagement with heritage was lower than the England average, Cheshire East (73%) and Westmorland and Furness (72%) local authorities were higher than the average.
Figure 4.11: Physical engagement with the heritage sector, by Local Authority[footnote 14][footnote 15]: 2023/24 (Base: All adults)

Figure 4.12 shows that for digital engagement with heritage, adults in London (26%) engaged slightly more than the England average (25%), whilst adults in Yorkshire and the Humber (22%) and the East Midlands (23%) regions engaged less. Of 296 LAs, 91% are not significantly different to the England average, with 4% above and 5% below, although some of these differences are small but significant. In general, the patterns of usage at the regional level are also observed at the local authority (LA) level. However, there are a few exceptions:
-
In London (26%) where digital engagement with heritage was slightly higher than the England average, Redbridge (18%) local authority engaged less.
-
In the East Midlands (23%) where digital engagement with heritage was lower than the England average, High Peak (33%) local authority engaged more.
Figure 4.12: Digital engagement with the heritage sector, by Local Authority[footnote 14][footnote 15], England: 2023/24 (Base: All adults)
Barriers to engagement
Respondents who did not engage with the heritage sector were asked why they did not. The most common reasons given are shown in Figure 4.13 and were:
- For physical engagement, ‘No reason in particular’ (32%) and ‘I’m not interested’ (25%) were the most common barriers cited for not engaging with the heritage sector.
- For digital engagement, similarly, ‘I’m not interested’ (40%) and ‘No reason in particular’ (33%) were most commonly identified as barriers to engaging with the heritage sector.
Figure 4.13: Reasons for not physically or digitally engaging with the heritage sector, England: 2023/24 (Base: Adults who did not engage with heritage sector)

5. Museums and Cultural Property
For physical engagement, respondents were asked about their visits to museums and galleries in the 12 months prior to completing the survey. Digital engagement with museums and galleries includes having taken a virtual tour of a museum or gallery in England or researching items from a museums and gallery collection in England online. The full list of qualifying digital museum activities we asked about are in Annex 3 and shown in Figure 5.5.
Headline findings
During May 2023 to March 2024 (2023/24), nearly half of adults 46% engaged with museums and galleries in the last 12 months, a 11 percentage point increase from 2022/23 (35%).
Figure 5.1 shows that 43% of adults engaged with museums and galleries physically in the previous 12 months to being surveyed, a 10 percentage point increase from 2022/23 (33%). The corresponding figure for digital engagement was 13%, a 4 percentage point increase from 2022/23 (9%).
Figure 5.1: Engagement with museums and galleries , England: 2022/23 – 2023/24 (Base: All adults)

Figure 5.2 shows that of the 46% of adults who engaged with museums and galleries, 33% of adults engaged exclusively physically, whilst 10% engaged both physically and digitally and only 3% engaged exclusively digitally.
Figure 5.2: Physical and digital engagement with museums and galleries, England: 2023/24 (Base: All adults)

Figure 5.3 shows that of those who physically engaged with museums and galleries, the most frequent level[footnote 22] at which adults visited museums and galleries was at least three to fours times a year (33%). Similarly, of those who digitally engaged with the museums and galleries, the most frequent level at which adults engaged online was also three to four times a year (33%).
Figure 5.3: Frequency of physical and digital engagement with museums and galleries, England: 2023/24 (Base: Adults who physically or digitally engaged with museums and galleries)

Figure 5.4 shows that the most popular reason for visiting museums and galleries was “General interest in the subject of the museum or collection” (65%), followed by “To spend time with family or friends” (54%).
Figure 5.4: Reasons for visiting museums and galleries, England: 2023/24 (Base: Adults who physically engaged with museums and galleries)

Figure 5.5 shows that the majority of adults did not engage with the digital museums and galleries activities listed in the survey (87%). From the options listed in the survey, “Researched items from a museum or gallery collection in England online” (7%) and “Engaged with multimedia content from Museums and galleries in England” (6%) were the next most popular activity undertaken .
Figure 5.5: Forms of digital engagement with museums and galleries, England: 2023/24 (Base: All adults)

The survey also asked respondents if they had taken part in metal detecting or mudlarking in the last 12 months. The majority of respondents did none of these activities (98%), however,
- 1% of adults reported that they had taken part in mudlarking
- 1% of adults reported they had taken part in metal detecting to search for historic artefacts. Of these respondents,
- 67% reported they did this as ‘As an individual or part of a social group’
- 21% reported they did this as ‘Part of a metal-detecting club’
- 14% reported they did this as ‘As part of an organised archaeological survey in a volunteer role’
Who engaged with museums and galleries?[footnote 8]
Figure 5.6 shows that in 2023/24:
- Age: There were some variations in engagement with museums and galleries between adults of different age groups. For instance, adults aged 85 and over were the least likely to visit museums and galleries (18%) or engage with museums and galleries digitally (9%) compared to adults from all other age groups presented here. There were other variations, for instance, 16–19 year old adults (34%) were less likely to visit a museum than adults from all other age groups presented here, with the exception of adults aged 80 or over. Whereas 16–19 year old adults (17%) were more likely to digitally engage with museums than adults from all other age groups presented here, with the exception of 70–74 year old adults.
- Disability Status: Non-disabled adults (46%) were more likely to visit museums and galleries than disabled adults (37%). There were no differences in digital engagement with museums and galleries between disability statuses.
Figure 5.6: Physical and digital engagement with the museums and galleries sector, by age and disability status, England: 2023/24 (Base: All adults)

Figure 5.7 shows that in 2023/24:
- Sex: Female adults (44%) were more likely to visit museums and galleries than male adults (42%). However, male adults (14%) were slightly more likely to digitally engage with museums and galleries than female adults (13%).
- Gender identity: For physical engagement with museums and galleries, there were no differences observed between adults whose gender identity was the same as their sex registered at birth and adults who reported that their gender identity was different from their sex registered at birth. However, for digital engagement, adults who reported that their gender identity was different from their sex registered at birth (22%) digitally engaged with the museums and galleries more than adults whose gender identity was the same as their sex registered at birth (13%).
- Sexual Orientation: Heterosexual or straight adults physically (44%) or digitally (13%) engaged with the museums and galleries less than all other sexual orientation classifications presented here. Bisexual adults (57%) or gay or lesbian adults (56%) engaged more physically with museums and galleries than adults in the “other” sexual orientation (50%). Adults in the “other” sexual orientation (30%) digitally engaged with museums and galleries more than bisexual adults (24%) or gay or lesbian adults (18%). Bisexual adults (24%) digitally engaged more than gay or lesbian adults (18%). There were no other differences in engagement with museums and galleries between the sexual orientation classifications presented here.
Figure 5.7: Physical and digital engagement with the museums and galleries sector, by sex[footnote 9], gender identity[footnote 10] and sexual orientation[footnote 11], England: 2023/24 (Base: All adults)

Figure 5.8 shows that:
- Religion: There was some variation in museums and galleries engagement for adults of different religious groups. For example, Muslim adults (31%) or Sikh adults (29%) were less likely to visit museums and galleries than adults from any of the other religious groups presented here (41–57%). Christian adults (13%) or non-religious adults (13%) were less likely to digitally engage in museums and galleries than adults from any of the other religious groups presented here (17–24%).
- Ethnicity: There was a lot of variation in physical engagement with museums and galleries for adults of different ethnic groups. For example, adults from the Chinese ethnic group (67%) were more likely to visit museums and galleries than adults from all other ethnic groups presented here, with the exception of adults in the “any other” ethnic group (62%) . For digital engagement, white British adults[footnote 17] (12%) engaged the least digitally with museums and galleries than adults from all other ethnic groups presented here (15–40%), with the exception of adults from the black Caribbean ethnic group (14%) and the mixed white and black Caribbean ethnic group (15%).
Figure 5.8: Physical and digital engagement with museums and galleries, by religion and ethnicity, England: 2023/24 (Base: All adults)

| Bar label | Ethnicity | Bar label | Ethnicity | Bar label | Ethnicity |
|---|---|---|---|---|---|
| A | Bangladeshi | G | Caribbean | M | Arab |
| B | Chinese | H | Any other black, African, or Caribbean background | N | Any other ethnic group |
| C | Indian | I | Mixed white and Asian | O | English, Welsh, Scottish, Northern Irish, or British |
| D | Pakistani | J | Mixed white and black African | P | Gypsy or Irish Traveller |
| E | Any other Asian background | K | Mixed white and black Caribbean | Q | Irish |
| F | African | L | Any other multi-ethnic background | R | Any other white background |
Figure 5.9 shows that:
- Socio-economic classification: There was some variation in both physical and digital engagement in the museums and galleries for adults of different socio-economic classifications. Adults from the higher managerial, administrative and professional occupations classification engaged physically (54%) and digitally (15%) with museums and galleries more than adults from all other socio-economic classifications presented here. Adults from the never worked and long-term unemployed classification engaged physically (25%) less with museums and galleries than adults from all other socio-economic classifications presented here (31–54%). Adults from the never worked and long-term unemployed classification engaged digitally (15%) more with museums and galleries than adults from the intermediate occupations classification (11%) or adults from routine and manual occupations classifications (10%).
- Index of Multiple Deprivation (IMD): There were some variations in museum and gallery engagement between adults from different deprivation deciles. For instance, adults from the lowest decile (most deprived) (31%) were less likely to visit museums and galleries than adults from all other deciles presented here (36–51%). Whereas, adults from the highest decile (the least deprived) (51%) were more likely to visit museums and galleries than adults from all other deciles presented here (31–48%). There were no differences observed between adults digitally engaging with museums in different deprivation deciles.
Figure 5.9: Physical and digital engagement with the museums and galleries, by socio-economic classification[footnote 12] and Index of Multiple Deprivation[footnote 13], England: 2023/24 (Base: All adults)

| Bar label | Socio-Economic Classification |
|---|---|
| A | Higher managerial, administrative, and professional occupations |
| B | Intermediate occupations |
| C | Routine and manual occupations |
| D | Never worked and long-term unemployed |
Geographical findings
Figure 5.10 shows that compared with the England average (43%), adults in London (56%) and South East (46%) regions visited museums and galleries more, whilst adults in the North West (41%), East of England (41%), Yorkshire and the Humber (40%), North East (39%), East Midlands (37%) and West Midlands (35%) regions physically engaged with museums and galleries less than the England average. Of 296 LAs, 50% are not significantly different to the England average, with 19% above and 31% below, although some of these differences are small but significant. In general, the patterns of usage at the regional level are also observed at the local authority (LA) level. However, there are some exceptions:
- In the London (56%) region where physical engagement with museums and galleries was higher than the England average, Barking and Dagenham (37%) local authority was lower than the average.
- In the South East (46%) region where physical engagement was higher than the England average, the following LA’s were lower than the average: Arun (37%), Bracknell Forest (37%), Crawley (37%), Dartford (36%), Gosport (37%), Gravesham (29%), Havant (34%), Isle of Wight (34%), Medway (37%), Rushmoor (37%), Slough (35%) and Swale (36%).
- In the East of England (41%) region where physical engagement with museums and galleries was lower than the England average, Cambridge (74%), South Cambridgeshire (59%), St Albans (61%) and Three Rivers (49%) local authorities were higher than average.
- In the West Midlands (35%) region where physical engagement with museums and galleries was lower than the England average, Warwick (53%) was higher than the average.
- In the Yorkshire and Humber region (40%), where physical engagement with museums and galleries was lower than the England average, York (59%) and North Yorkshire (46%) local authority was higher than the average.
- In the North West region (41%), where physical engagement with museums and galleries was lower than the England average, Liverpool (55%), Manchester (50%), Trafford (51%), and Wirral (51%) local authorities were higher than average.
Figure 5.10: Physical engagement with museums and galleries, by Local Authority[footnote 14][footnote 15], England: 2023/24 (Base: All adults)
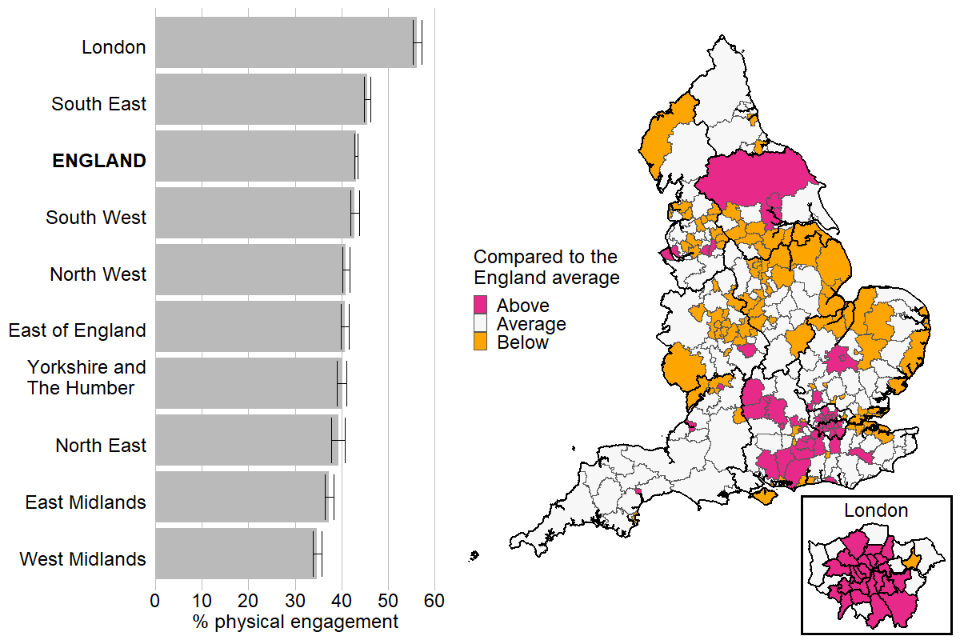
Figure 5.11 shows that, similarly to physical engagement with museums and galleries, compared with the England average (13%), adults in London (18%) region digitally engaged with museums and galleries more, whilst adults in the South West (13%), North West (12%), Yorkshire and the Humber (12%), regions digitally engaged with museums and galleries slightly less and adults in East Midlands (11%) and North East (11%) regions digitally engaged with museums and galleries less than the England average. Of 296 LAs, 78% are not significantly different to the England average, with 10% above and 11% below, although some of these differences are small but significant. In general, the patterns of usage at the regional level are also observed at the local authority (LA) level.However, there are a few exceptions:
- In the South West (13%) and North West (12%) regions digital engagement with museums and galleries was slightly lower than the England average, however, Bristol (17%) and City of Manchester (18%) local authorities were higher than the average.
Figure 5.11: Digital engagement with museums and galleries, by Local Authority[footnote 14][footnote 15], England: 2023/24 (Base: All adults)
Barriers to engagement
Respondents who did not engage with museums and galleries were asked why they did not. The most common reasons given are shown in Figure 5.12 and were:
- For physical engagement, ‘I’m not interested’ (30%) and ‘No reason in particular’ (27%) were the most common barriers cited for not engaging with museums and galleries.
- For digital engagement – similarly ‘I’m not interested’’ (40%) and ‘No reason in particular’ (31%) were most commonly identified as barriers to engaging with museums and galleries.
Figure 5.12: Reasons for not physically or digitally engaging with museums and galleries, England: 2023/24 (Base: Adults who did not engage with museums and galleries)

6. Live Sports & Gambling
Respondents were asked information about attendance at live sports in the last six months (that is, covering the period October 2022 to March 2024). Note that questions related to gambling refers to the last 12 months (that is, covering the period May 2022 to March 2024).
Headline findings
31%of adults reported that they had watched live sports in person in the last six months, a 9 percentage point increase from 2022/23 (22%), as shown in Figure 6.1.
Nearly three quarters (73%) of respondents watched live sports on TV in the last twelve months, a 14 percentage point increase from 2022/23 (59%).
Figure 6.1: Attendance in person and watching on TV of live sporting events, England: 2022/23 – 2023/24 (Base: Adults in subsample of approximately a third of online respondents)

Of the 31% of adults who watched any live sports in person in the last 6 months, Figure 6.2 shows the order of popularity was:
- Men’s football (60%)
- Rugby (20%)
- Some other type of sport (17%) (any sport not listed in Figure 6.2)[footnote 23]
- Cricket (16%)
These were the most popular sports in the previous year too (excluding Men’s football[footnote 24]).
Of the 73% of adults who watched any live sports on TV, Figure 6.2 shows the order of popularity was:
- Men’s Football (53%)
- Women’s football (34%)
- Tennis (30%)
Bearing in mind that more people watched any sports on TV than in person (73% versus 31%), Figure 6.2 shows the popularity of the different sports that were watched as a proportion of adults who said yes to watching at least one live sport or yes to watching at least one sport on TV.
Figure 6.2: Ranking the popularity of live sporting events watched in person in the previous 6 months, and watched on TV in the previous 12 months, England: 2023/24. (Base: Adults who watched at least one live sporting event in person / Adults who watched at least one live sporting event on TV)

57% of respondents who watched live sports on TV said all of these events were professional sports where the participants were being paid, whereas 13% said most of them were. 14% of respondents said none of the events were professional sports where the participants were being paid.
Around 25% of adults who attended live sports (of any type) in person in the previous 6 months placed a bet. This compares to 17% of adults who watched live sports on TV who placed a bet while watching. Figure 6.3 shows that of the adults who attended live sports in person and placed bets:
- 38% reported to do so very rarely,
- 38% said some of the time,
- 15% said most of the time.
Whereas, of the adults who watched live sports on TV and placed bets:
- 49% did so very rarely,
- 34% placed a bet some of the time,
- 11% placed a bet most of the time.
Figure 6.3: Engagement in betting during watching live sports in person and on TV, by frequency, England: 2023/24. (Base: Adults who watched at least one live sporting event in person and placed a bet / Adults who watched at least one live sporting event on TV and placed a bet)

Who watched live sports?[footnote 8]
Figure 6.4 shows:
- Age: There were some variations in watching live sports between adults of different age groups. For instance, adults aged 85 and over were the least likely to watch live sports (13%) compared to adults from all other age groups presented here, whilst adults aged 16–19 (35%) and 45–49 (34%) were more likely to watch live sports than adults aged 70 and over (13–29%).
- Disability Status: Non-disabled adults (34%) were more likely to have attended live sporting events in person than disabled adults (23%).
Figure 6.4: Attendance of live sporting events in the previous 6 months, by age and disability status, England: 2023/24. (Base: Adults in subsample of approximately a third of online respondents)

Figure 6.5 shows:
- Sex: Male adults (40%) were more likely to have attended live sporting events than female adults (22%).
- Gender identity: Adults whose gender identity was the same as their sex registered at birth (31%) were more likely to have attended live sporting events than adults who reported that their gender identity was different from their sex registered at birth (24%).
- Sexual Orientation: Heterosexual or straight adults (32%) were more likely to attend live sporting events than adults of other sexual orientations (15%–23%).
Figure 6.5: Attendance of live sporting events in the previous 6 months, by sex[footnote 9], gender identity[footnote 10] and sexual orientation[footnote 11], England: 2023/24. (Base: Adults in subsample of approximately a third of online respondents)

Figure 6.6 shows that:
- Religion: Non-religious adults (32%) were more likely to attend live sporting events compared to Buddhist adults (17%), Muslim adults (21%), or adults in the “other” religious classification (22%). Jewish adults (35%) were more likely to attend live sporting events than Muslim adults (21%) or Buddhist adults (17%). There were no other differences in the attendance of live sporting events between the religious groups presented here.
- Ethnicity: There was some variation in live sport attendance for adults of different ethnic groups. For example, adults from the white British adults[footnote 17] (33%) were more likely to attend live sporting events than adults from the “any other white background” ethnic group (22%).
Figure 6.6:Attendance of live sporting events in the previous 6 months, by religion and ethnicity, England: 2023/24. (Base: Adults in subsample of approximately a third of online respondents)
Note: “Any other black, African, or Caribbean background” (H) ethnicity group is not shown due to the data being suppressed because fewer than 30 respondents selected this option.

| Bar label | Ethnicity | Bar label | Ethnicity | Bar label | Ethnicity |
|---|---|---|---|---|---|
| A | Bangladeshi | G | Caribbean | M | Arab |
| B | Chinese | H | Any other black, African, or Caribbean background | N | Any other ethnic group |
| C | Indian | I | Mixed white and Asian | O | English, Welsh, Scottish, Northern Irish, or British |
| D | Pakistani | J | Mixed white and black African | P | Gypsy or Irish Traveller |
| E | Any other Asian background | K | Mixed white and black Caribbean | Q | Irish |
| F | African | L | Any other multi-ethnic background | R | Any other white background |
Figure 6.7 shows that:
- Socio-economic classification: Adults from the higher managerial, administrative and professional occupations classification (34%) were more likely to attend live sporting events compared to adults from all other classifications presented here (20–30%). Adults in the never worked or long-term unemployed classification (20%) were less likely to attend live sporting events compared to all the other classifications presented here (29–34%).
- Index of Multiple Deprivation (IMD): There was some variation in live sporting event attendance for adults in different deciles. Adults from the highest two deciles (least deprived) were more likely to attend live sporting events (37%) compared to adults from the lowest seven deciles (24–31%). Adults from the lowest two deciles (most deprived) were less likely to attend live sporting events compared to adults from the remainder of the deciles (highest eight) (28–37%).
Figure 6.7: Attendance of live sporting events in the previous 6 months, by socio-economic classification[footnote 12] and Index of Multiple Deprivation[footnote 13], England: 2023/24 (Base: Adults in subsample of approximately a third of online respondents)

| Bar label | Socio-Economic Classification |
|---|---|
| A | Higher managerial, administrative, and professional occupations |
| B | Intermediate occupations |
| C | Routine and manual occupations |
| D | Never worked and long-term unemployed |
Geographical findings
Adults from the North West (33%) were the only region that was more likely to attend live sporting events than the average for England (31%).
Figure 6.8 shows that adults from Merseyside (35%) were the only ITL2 region more likely to attend live sporting events than the average for England as a whole (31%). Adults from the West Midlands (26%) and Outer London – East and North East (24%) were the only ITL2 regions that were less likely to attend live sporting events than the England average.
Figure 6.8:Attendance of live sporting events in the previous 6 months, by ITL2 region (county), England: 2023/24 (Base: Adults in subsample of approximately a third of online respondents)

Barriers to engagement
Respondents were asked reasons why they had not attended live sporting events. The most common reasons given are shown in Figure 6.9 and were:
- ‘I’m not interested’ (47%)
- ‘I cannot afford it’ (19%)
- ‘No reason in particular’ (17%)
Figure 6.9: Reasons for not attending live sport, England: 2023/24. (Base: Adults who had not attended any live sporting events in person)

7. Domestic Tourism
Adults in England were asked about any domestic holidays (that is, holidays in England) they took in the last 12 months. These questions were asked to a subsample of approximately a third of online respondents, so the results may be affected due to only respondents who are already using the internet responding to these questions.
Headline findings
During May 2023 to March 2024 (2023/24), over 3 in 5 adults (64%) took a holiday in England in the previous 12 months to being surveyed, a 3 percentage point increase from 2022/23 (60%), as shown in Figure 7.1.
Figure 7.1: Engagement in the domestic tourism sector, England: 2022/23 – 2023/24 (Base: Adults in subsample of approximately a third of online respondents)

Of these who took a holiday in the England:
- A third stayed 1 to 2 nights (35%).
- Almost half spent 3 to 6 nights (46%).
- Nearly a fifth stayed 7 to 10 nights (15%).
- Only 4% stayed more than 10 nights.
Figure 7.2: Percentage of adults who took a holiday in England in the previous 12 months, by length of stay, England: 2023/24. (Base: Adults who took a holiday in England)

Figure 7.3 shows that nearly a third (30%) of adults who took a holiday in England stayed at a traditional coastal or seaside town, whilst 28% stayed in the countryside or in a village and a quarter (25%) stayed in a city or large town.
Figure 7.3: Percentage of adults who took a holiday in England in the previous 12 months, by location type, England: 2023/24. (Base: Adults who took a holiday in England)

Of those who took a holiday in England, 45% said they visited museums, galleries, heritage or cultural sites or events while they were away, an increase of 2 percentage points from 2022/23 (43%).
Who engaged with the domestic tourism sector?[footnote 8]
Figure 7.4 shows:
- Age: Adults aged 85 or over (39%) were less likely to take a holiday in England compared to adults from all other age groups presented here. There were also other variations, for instance 70–74 year old adults (70%) were more likely to take a holiday in England than 16–19 year old adults, 20–24 year old adults, and 80–84 year old adults (56–59%).
- Disability Status: Non-disabled adults (68%) were more likely to take a holiday in England than disabled adults (57%).
Figure 7.4: Engagement with the domestic tourism sector, by age and disability status, England: 2023/24. (Base: Adults in subsample of approximately a third of online respondents)

Figure 7.5 shows that:
- Sex: Female adults (65%) were more likely to take a holiday in England than male adults (63%).
- Gender identity: Adults whose gender identity was the same as their sex registered at birth (64%) were more likely to take a holiday in England than adults who reported that their gender identity was different from their sex registered at birth (59%).
- Sexual Orientation: Adults in the “other sexual orientation” classification (53%) were less likely to take a holiday in England than all other sexual orientation classifications presented here (65%). There were no other differences in domestic tourism between the sexual orientation classifications presented here.
Figure 7.5: Engagement with the domestic tourism sector, by sex[footnote 9], gender identity[footnote 10] and sexual orientation[footnote 11], England: 2023/24. (Base: Adults in subsample of approximately a third of online respondents)

Figure 7.6 shows that:
- Religion: There was some variation in domestic tourism for adults from different religious groups. For example, Muslim adults (38%) were less likely to take a domestic holiday in England than adults from all other religious groups presented here (52–67%). Non-religious adults (66%) were more likely to take a domestic holiday in England than adults from all other religious groups presented here, with the exception of Christian adults (67%), and Jewish adults (65%).
- Ethnicity: There was a lot of variation in domestic tourism for adults from different ethnic groups. For example, white British adults[footnote 17] (68%) were more likely to take a holiday in England compared to adults from most other ethnic groups, with the exceptions of adults in the Chinese, any other Asian Background, Mixed white and Asian, Any other multi-ethnic background, any other ethnic group, and Irish ethnic groups.
Figure 7.6: Engagement with the domestic tourism sector, by religion and ethnicity, England: 2023/24. (Base: Adults in subsample of approximately a third of online respondents)
Note: “Any other black, African, or Caribbean background” (H) ethnicity group is not shown due to the data being suppressed because fewer than 30 respondents selected this option.

| Bar label | Ethnicity | Bar label | Ethnicity | Bar label | Ethnicity |
|---|---|---|---|---|---|
| A | Bangladeshi | G | Caribbean | M | Arab |
| B | Chinese | H | Any other black, African, or Caribbean background | N | Any other ethnic group |
| C | Indian | I | Mixed white and Asian | O | English, Welsh, Scottish, Northern Irish, or British |
| D | Pakistani | J | Mixed white and black African | P | Gypsy or Irish Traveller |
| E | Any other Asian background | K | Mixed white and black Caribbean | Q | Irish |
| F | African | L | Any other multi-ethnic background | R | Any other white background |
Figure 7.7 shows that:
- Socio-economic classification: Adults from the higher managerial, administrative and professional occupations classification (72%) were more likely to take a domestic holiday than adults from all other classifications presented here. Adults from the never worked and long-term unemployed classification (42%) were less likely to take a domestic holiday than adults from all other socio-economic classifications presented here (58–72%) . Adults from the intermediate occupations classification (65%) were more likely to take a domestic holiday than adults from the routine or manual occupations classification (58%).
- Index of Multiple Deprivation (IMD): There was a general negative correlation between taking a domestic holiday and deprivation—as deprivation decreases the likelihood of taking a holiday in England increased. Adults from the lowest decile (the most deprived) were less likely to have taken a holiday in England last year, than those from the highest decile (the least deprived), 50% compared to 75%.
Figure 7.7: Engagement with the domestic tourism sector, by socio-economic classification[footnote 12] and Index of Multiple Deprivation[footnote 13], England: 2023/24 (Base: Adults in subsample of approximately a third of online respondents)

| Bar label | Socio-Economic Classification |
|---|---|
| A | Higher managerial, administrative, and professional occupations |
| B | Intermediate occupations |
| C | Routine and manual occupations |
| D | Never worked and long-term unemployed |
Geographical findings
Adults from the London (57%) region were less likely to take a holiday in England than the average for England as a whole (64%). Adults from the South East (66%), South West (68%), and East Midlands (69%) regions were all more likely to take a holiday in England than the average for England as a whole.
Figure 7.8 shows that there was a lot of variation in the proportion of adults from different ITL2 regions who took a holiday in England. Adults from Outer London – West and North West (58%), Outer London – East and North East (51%), Inner London – West (57%), Inner London – East (56%), Greater Manchester (57%), and West Midlands (58%) ITL2 (county) regions were less likely to take a holiday in England than adults in England as a whole. Several ITL2 regions were more likely to take a holiday in England than adults in England as a whole.
Figure 7.8: Engagement with domestic tourism, by ITL2 region (county), England: 2023/24 (Base: Adults in subsample of approximately a third of online respondents)

Barriers to engagement
Respondents were asked why they did not take a holiday in England in the previous 12 months of being surveyed. The most common reasons given are shown in Figure 7.9 and were:
- ‘I cannot afford it’ (38%)
- ‘I went abroad rather than taking a holiday in England’ (24%)
- ‘No reason in particular’ (19%)
Figure 7.9: Reasons for not taking a holiday in England, England: 2023/24. (Base: Adults who did not take a holiday in England)

8. Coronation of His Majesty The King
Respondents were asked for their awareness of the Coronation of His Majesty The King. These questions were asked to a subsample of approximately a third of online respondents, so the results may be affected due to only respondents who are already using the internet responding to these questions.
Headline findings
During May 2023 to March 2024 (2023/24): 89% of adults were aware of the Coronation of His Majesty The King.
Of those adults who were aware of the Coronation of His Majesty The King, around half of adults actually participated in the event (49%)[footnote 25]. Of these respondents who participated in the event, Figure 8.1 shows that:
-
88% followed coverage on TV or radio (including watching the event and/or news about the event).
-
26% followed this event on social media.
-
16% attended a local event
Figure 8.1: Participation in the Coronation of His Majesty The King events, England: 2023/24 (Base: Adults aware of the event)

Who is aware of the Coronation of His Majesty The King?[footnote 8]
Figure 8.2 shows that in 2023/24:
- Age: Adults aged 24 and below (77–78%) were less likely to be aware of the Coronation of His Majesty The King compared to adults from all other age groups presented here. There were also other variations; for instance, 75–79 year old adults (98%) were more likely to be aware of the event than all other age groups, with the exception of adults aged 70–74 (97%), 80–84 (97%) and 85 or over (96%).
- Disability Status: Disabled adults (91%) were slightly more aware of the Coronation of His Majesty The King than non-disabled adults (90%).
Figure 8.2: Awareness of the Coronation of His Majesty The King, by age and disability status, England: 2023/24. (Base: Adults in subsample of approximately a third of online respondents)

Figure 8.3 shows that in 2023/24:
- Sex: Female adults (90%) were slightly more aware of the Coronation of His Majesty The King than male adults (89%).
- Gender identity: Adults whose gender identity was the same as their sex registered at birth (90%) were more aware of the Coronation of His Majesty The King than adults who reported that their gender identity was different from their sex registered at birth (80%).
- Sexual Orientation: Adults in the ‘other’ sexual orientation classification (74%) were less aware of the Coronation of His Majesty The King than adults from all other sexual orientation classifications presented here (86–91%). Heterosexual adults (91%) were more aware of the event than adults from all other sexual orientation classifications presented here, with the exception of Gay or Lesbian adults (89%). There were no other differences between the sexual orientation classifications presented here.
Figure 8.3: Awareness of the Coronation of His Majesty The King, by sex[footnote 9], gender identity[footnote 10] and sexual orientation[footnote 11], England: 2023/24. (Base: Adults in subsample of approximately a third of online respondents)

Figure 8.4 shows that:
- Religion: There was some variation in awareness of the Coronation of His Majesty The King for adults of different religious groups. For example, Christian adults (94%) were the most aware of the event compared to all other religious groups presented here (72–89%).
- Ethnicity: There was some variation in awareness of the Coronation of His Majesty The King for adults of different ethnic groups. For example, adults from the white Gypsy and Irish Traveller ethnic group (45%) were the least likely to have heard of the event than all other ethnic groups presented here (70–92%). White British adults[footnote 17] were more likely to be aware of the event than all other ethnic groups with the exception of adults from the ‘other’ mixed or multiple ethnic background (90%).
Figure 8.4: Awareness of the Coronation of His Majesty The King, by religion and ethnicity, England: 2023/24. (Base: Adults in subsample of approximately a third of online respondents)
Note: “Any other black, African, or Caribbean background” (H) ethnicity group is not shown due to the data being suppressed because fewer than 30 respondents selected this option.

| Bar label | Ethnicity | Bar label | Ethnicity | Bar label | Ethnicity |
|---|---|---|---|---|---|
| A | Bangladeshi | G | Caribbean | M | Arab |
| B | Chinese | H | Any other black, African, or Caribbean background | N | Any other ethnic group |
| C | Indian | I | Mixed white and Asian | O | English, Welsh, Scottish, Northern Irish, or British |
| D | Pakistani | J | Mixed white and black African | P | Gypsy or Irish Traveller |
| E | Any other Asian background | K | Mixed white and black Caribbean | Q | Irish |
| F | African | L | Any other multi-ethnic background | R | Any other white background |
Figure 8.5 shows that:
- Socio-economic classification: Adults from the never worked and long-term unemployed classification (80%) were less aware of the Coronation of His Majesty The King than adults from all other socio-economic classifications presented here (90–93%). Adults from the higher managerial, administrative and professional occupations classification (92%) or adults from Intermediate occupations (93%) were more aware of the event than adults from all other socio-economic classifications presented here (80–90%). There were no other differences between the socio-economic classifications presented here for awareness of the Coronation of His Majesty the King.
- Index of Multiple Deprivation (IMD): Adults from the lowest decile (the most deprived) (81%) were the least aware of the Coronation of His Majesty The King compared to adults from all other deciles presented here (86%–94%). There were also some other variations; for instance, adults from the highest decile (the least deprived) (94%) were the most aware of the event compared to adults from all the other deciles presented here with the exception of the seventh, eighth and ninth deciles.
Figure 8.5: Awareness of the Coronation of His Majesty The King, by socio-economic classification[footnote 12] and Index of Multiple Deprivation[footnote 13], England: 2023/24 (Base: Adults in subsample of approximately a third of online respondents)

| Bar label | Socio-Economic Classification |
|---|---|
| A | Higher managerial, administrative, and professional occupations |
| B | Intermediate occupations |
| C | Routine and manual occupations |
| D | Never worked and long-term unemployed |
Geographical findings
Figure 8.6 shows that, adults from the London (86%) and West Midlands (87%) region were less likely to be aware of The Coronation of His Majesty the King event than the average for England as a whole (89%). Whereas, adults from the South East (92%), South West (92%), and East of England (91%) regions were all more likely to be aware of The Coronation of His Majesty the King event than the average for England as a whole (89%).
There was a lot of variation in the proportion of adults from different ITL2 regions who were aware of the event.
- Adults from Inner London – West (85%), Greater Manchester (85%), West Midlands (83%) and Inner London – East (83%) ITL2 regions were less likely to be aware of the event than adults in England as a whole (89%).
- Adults from, Cornwall and Isles of Scilly (93%), Dorset and Somerset (93%), Hampshire and Isle of Wight (93%), North Yorkshire (92%), Cheshire (92%), Surrey, East and West Sussex (92%), Berkshire, Buckinghamshire and Oxfordshire (92%), East Anglia (91%) ITL2 regions were more likely to be aware of the event than adults in England as a whole (89%).
Figure 8.6: Awareness of the Coronation of His Majesty The King, by ITL2 region (county), England: 2023/24 (Base: Adults in subsample of approximately a third of online respondents)

9. Coventry City of Culture 2021
Respondents were asked about their awareness of the “Coventry City of Culture 2021” major event. These questions were asked to a subsample of approximately a third of online respondents, so the results may be affected due to only respondents who are already using the internet responding to these questions.
Headline findings
During May 2023 to March 2024 (2023/24): 16% of respondents were aware of the Coventry City of Culture 2021, a 7 percentage point decrease from 2022/23 (23%).
Of those adults who were aware of the Coventry City of Culture 2021, 10% actually participated in the event, a 3 percentage point increase from 2022/23 (7%)[footnote 25]. Of these respondents who participated in the event, Figure 9.1 shows that:
- Over half of adults (52%) followed coverage on TV or radio (including watching the event and/or news about the event).
- 36% attended a local event.
- Around a quarter of adults (24%) followed this event on social media.
Figure 9.1: Methods of participation in Coventry City of Culture 2021, England: 2023/24 (Base: All adults that participated in the event)

Who is aware of the Coventry City of Culture 2021?
Figure 9.2 shows that in 2023/24:
- Age: There was some variation in awareness of the Coventry City of Culture event for adults of different age groups. For instance, adults aged 16–19 (7%) were less aware of the event than all other age classifications presented here (9–28%) with the exception of adults aged 20–24 (7%). Adults aged 70–84 (26–28%) were more likely to be aware of this event than all other age classifications presented here (7–21%) with the exception of adults aged 65–69 (24%).
- Disability Status: There were no differences observed in awareness of this event between adults of different disability status.
Figure 9.2: Awareness of the Coventry City of Culture 2021, by age and disability status, England: 2023/24. (Base: Adults in subsample of approximately a third of online respondents)

Figure 9.3 shows that in 2023/24:
- Sex:Male adults (17%) were more likely to be aware of this event than female adults (15%).
- Gender identity: There were no differences observed between adults whose gender identity was the same as their sex registered at birth and adults who reported that their gender identity was different from their sex registered at birth.
- Sexual Orientation: Adults in the “other” sexual orientation classification (11%) were less likely to be aware of this event compared to heterosexual or straight adults (16%) or gay or lesbian adults (17%). There were no other differences in awareness of this event between the sexual orientation classifications presented here.
Figure 9.3: Awareness of the Coventry City of Culture 2021, by sex[footnote 9], gender identity[footnote 10] and sexual orientation[footnote 11], England: 2023/24. (Base: Adults in subsample of approximately a third of online respondents)

Figure 9.4 shows that:
- Religion: There was some variation in awareness of the Coventry City of Culture event for adults of different religious groups. For example, Muslim adults (6%) were less aware of this event than adults from all other religious groups presented here (11–19%), with the exception of Hindu adults (9%).
- Ethnicity: There was a lot of variation in awareness of the Coventry City of Culture event for adults of different ethnic groups. For example, adults from the Arab ethnic group (2%) were less likely to be aware of this event than adults from all other ethnic groups presented here, with the exception of adults from the Bangladeshi (4%), Chinese (5%), Pakistani (5%) and adults from the other Asian background (5%) ethnic groups.
Figure 9.4: Awareness of the Coventry City of Culture 2021, by religion and ethnicity, England: 2023/24. (Base: Adults in subsample of approximately a third of online respondents)
Note: “Any other black, African, or Caribbean background” (H) ethnicity group is not shown due to the data being suppressed because fewer than 30 respondents selected this option.

| Bar label | Ethnicity | Bar label | Ethnicity | Bar label | Ethnicity |
|---|---|---|---|---|---|
| A | Bangladeshi | G | Caribbean | M | Arab |
| B | Chinese | H | Any other black, African, or Caribbean background | N | Any other ethnic group |
| C | Indian | I | Mixed white and Asian | O | English, Welsh, Scottish, Northern Irish, or British |
| D | Pakistani | J | Mixed white and black African | P | Gypsy or Irish Traveller |
| E | Any other Asian background | K | Mixed white and black Caribbean | Q | Irish |
| F | African | L | Any other multi-ethnic background | R | Any other white background |
Figure 9.5 shows that:
- Socio-economic classification: Adults from the higher managerial, administrative and professional occupations classification (20%) were more aware of this event than adults in all other classifications presented here (11–15%), whilst adults from routine and manual occupations classification (12%) and adults in the never worked or long-term unemployed classification (11%) were the least aware of the event. There were no other differences in awareness of this event between the socio-economic classifications presented here.
- Index of Multiple Deprivation (IMD): There was some variation in awareness of this event between adults of different deprivation deciles. Adults from the lowest decile (the most deprived) (10%) engaged were less aware of the event compared to adults from all other deciles, with the exception of adults from the second lowest decile (12%).
Figure 9.5: Awareness of the Coventry City of Culture 2021, by socio-economic classification[footnote 12] and Index of Multiple Deprivation[footnote 13], England: 2023/24 (Base: Adults in subsample of approximately a third of online respondents)

| Bar label | Socio-Economic Classification |
|---|---|
| A | Higher managerial, administrative, and professional occupations |
| B | Intermediate occupations |
| C | Routine and manual occupations |
| D | Never worked and long-term unemployed |
Geographical findings
Figure 9.6 shows that, Adults from the West Midlands (37%) and East Midlands (19%) regions were more likely to be aware of the Coventry City of Culture 2021 event than the average for England as a whole (16%). Whereas, adults from the South East (14%), Yorkshire and Humber (13%), East of England (12%), North East (11%), London (11%) and North West (11%) regions were all less likely to be aware of the Coventry City of Culture 2021 event than the average for England as a whole (16%).
There was a lot of variation in the proportion of adults from different ITL2 regions who were aware of the event.
- Adults from Herefordshire, Worcestershire and Warwickshire (51%), West Midlands (33%), Shropshire and Staffordshire (32%), Leicestershire, Rutland and Northamptonshire (25%), and, East Yorkshire and Northern Lincolnshire (20%) ITL2 regions were more likely to be aware of the event than adults in England as a whole (16%). These ITL2 areas are close to Coventry or Hull, both previous Cities of Culture.
- Adults from, Bedfordshire and Hertfordshire (12%), East Anglia (13%), Essex (11%), Greater Manchester (10%), Inner London – East (12%), Kent (11%), Lancashire (11%), Merseyside (11%), Northumberland and Tyne and Wear (11%), Outer London – East and North East (8%), Outer London – West and North West (10%), South Yorkshire (11%), Surrey, East and West Sussex (14%), Tees Valley and Durham (12%) and West Yorkshire (10%) ITL2 regions were less likely to be aware of the event than adults in England as a whole (16%).
Figure 9.6: Awareness of the Coventry City of Culture 2021, by ITL2 region (county), England: 2023/24 (Base: Adults in subsample of approximately a third of online respondents)

10. City of Culture Bradford 2025
Respondents were asked about their awareness of the “City of Culture Bradford 2025” major event. These questions were asked to a subsample of approximately a third of online respondents, so the results may be affected due to only respondents who are already using the internet responding to these questions.
Headline findings
During May 2023 to March 2024 (2023/24): 10% of respondents were aware of the City of Culture Bradford 2025
Of those adults who were aware of the City of Culture Bradford 2025,
- only a quarter of adults (25%) would be interested in participating in the event
- whilst 61% of adults were not interested in participating in the event
Figure 10.1: Interest in participation in City of Culture Bradford 2025 events, England: 2023/24 (Base: All adults aware of the event)

Who is aware of the City of Culture Bradford 2025?[footnote 8]
Figure 10.2 shows that:
- Age:There was some variation in awareness of the Bradford City of Culture 2025 between different aged classifications presented here. For example, adults 50 years old and above (11–16%) were more likely to be aware of this event than adults aged 49 and below (5–8%). Adults aged 70–79 years old (16%) were more likely to be aware of this event than all other age classifications presented here (5–12%) with the exception of 65–69 year olds (14%) and 80 years old and above adults (12–15%).
- Disability Status: There were no differences observed in awareness of the Bradford City of Culture 2025 between adults of different disability status.
Figure 10.2: Awareness of the City of Culture Bradford 2025, by age and disability status, England: 2023/24. (Base: Adults in subsample of approximately a third of online respondents)

Figure 10.3 shows that in 2023/24:
- Sex: Male adults (10%) were slightly more likely to be aware of Bradford City of Culture 2025 than female adults (9%).
- Gender identity: There were no differences observed between adults whose gender identity was the same as their sex registered at birth and adults who reported that their gender identity was different from their sex registered at birth.
- Sexual Orientation: Gay or Lesbian adults (13%) were more likely to be aware of Bradford City of Culture 2025 than heterosexual or straight adults (10%). There were no other differences observed between adults of different sexual orientation classifications presented here.
Figure 10.3: Awareness of the City of Culture Bradford 2025, by sex[footnote 9], gender identity[footnote 10] and sexual orientation[footnote 11], England: 2023/24. (Base: Adults in subsample of approximately a third of online respondents)

Figure 10.4 shows that:
- Religion: Christian adults (11%) were more aware of Bradford City of Culture 2025 than non-religious adults (9%), Muslim adults (8%), Hindu adults (5%) or Buddhist adults (5%). Non-religious adults (9%) were more aware of this event than Hindu adults (5%) or Buddhist adults (5%). There were no other differences in awareness of this event between the religious groups presented here.
- Ethnicity: There was some variation in awareness of Bradford City of Culture 2025 for adults of different ethnic groups. For example, Chinese adults (2%), Indian adults (6%) and adults from the “other” white ethnic background (5%) were less aware of the event than white British adults[footnote 17] (11%).
Figure 10.4: Awareness of the City of Culture Bradford 2025, by religion and ethnicity, England: 2023/24. (Base: Adults in subsample of approximately a third of online respondents)
Note: “Any other black, African, or Caribbean background” (H) ethnicity group is not shown due to the data being suppressed because fewer than 30 respondents selected this option.

| Bar label | Ethnicity | Bar label | Ethnicity | Bar label | Ethnicity |
|---|---|---|---|---|---|
| A | Bangladeshi | G | Caribbean | M | Arab |
| B | Chinese | H | Any other black, African, or Caribbean background | N | Any other ethnic group |
| C | Indian | I | Mixed white and Asian | O | English, Welsh, Scottish, Northern Irish, or British |
| D | Pakistani | J | Mixed white and black African | P | Gypsy or Irish Traveller |
| E | Any other Asian background | K | Mixed white and black Caribbean | Q | Irish |
| F | African | L | Any other multi-ethnic background | R | Any other white background |
Figure 10.5 shows that:
- Socio-economic classification: Adults from the higher managerial, administrative and professional occupations classification (12%) were more aware of Bradford City of Culture than adults in all other classifications presented here (7–9%), whilst adults from routine and manual occupations classification (8%) and adults in the never worked or long-term unemployed classification (7%) were the least aware of the event. There were no other differences in awareness of this event between the socio-economic classifications presented here.
- Index of Multiple Deprivation (IMD): There was some variation in awareness of this event between adults of different deprivation deciles. For example, adults from the third and fourth decile (both 8%) were less aware of the event than all other deciles with the exception of adults in the first (9%), second (8%), or sixth decile (12%).
Figure 10.5: Awareness of the City of Culture Bradford 2025, by socio-economic classification[footnote 12] and Index of Multiple Deprivation[footnote 13] England: 2023/24 (Base: Adults in subsample of approximately a third of online respondents)

| Bar label | Socio-Economic Classification |
|---|---|
| A | Higher managerial, administrative, and professional occupations |
| B | Intermediate occupations |
| C | Routine and manual occupations |
| D | Never worked and long-term unemployed |
Geographical findings
Figure 10.6 shows that adults from the Yorkshire and Humber (34%) region were the most likely to be aware of Bradford City of Culture 2025 than the average for England as a whole (10%). Whereas, adults from the West Midlands (8%), South West (7%), South East (7%), London (6%) and East of England (6%) regions were all less likely to be aware of Bradford City of Culture 2025 than the average for England as a whole (10%).
There was a lot of variation in the proportion of adults from different ITL2 regions who were aware of the event.
-
Adults from West Yorkshire (49%), North Yorkshire (33%), South Yorkshire (20%), East Yorkshire and North Lincolnshire (17%) ITL2 regions were more likely to be aware of the event than adults in England as a whole (10%).
-
Adults from Shropshire and Staffordshire (8%), West Midlands (8%), Northumberland and Tyne and Wear (7%), Devon (7%), Outer London – South (7%), Berkshire, Buckinghamshire and Oxfordshire (7%), Gloucestershire, Wiltshire and Bristol/Bath area (7%), East Anglia (7%), Surrey, East and West Sussex (6%), Inner London – East (6%), Inner London – West (6%), Outer London – West and North West (6%), Kent (6%), Bedfordshire and Hertfordshire (6%), Essex (5%) and Outer London – East and North East (5%) ITL2 regions were less likely to be aware of the event than adults in England as a whole (10%).
Figure 10.6: Awareness of the City of Culture Bradford 2025, by ITL2 region (county), England: 2023/24 (Base: Adults in subsample of approximately a third of online respondents)

11. UEFA Women’s EURO 2022
Respondents were asked about their awareness of the “UEFA Women’s EURO 2022” major event. These questions were asked to a subsample of approximately a third of online respondents, so the results may be affected due to only respondents who are already using the internet responding to these questions.
Headline findings
During May 2023 to March 2024 (2023/24), around two thirdsof respondents (67%) had heard of the UEFA Women’s EURO 2022.
Of those adults who were aware of the UEFA Women’s EURO 2022, 38% actually participated in the event[footnote 25]. Of these respondents who participated in the event, Figure 11.1 shows that:
- 94% followed coverage on TV or radio (including watching the event and/or news about the event).
- 29% followed this event on social media.
- Only 4% attended a local event.
Figure 11.1: Participation in UEFA Women’s EURO 2022 events, England: 2023/24 (Base: All adults that participated in the event)

Who is aware of the UEFA Women’s EURO 2022?[footnote 8]
Figure 11.2 shows that in 2023/24:
- Age: There was some variation in awareness of the UEFA Women’s EURO 2022 event between different aged classifications presented here. For example, adults aged 16 to 24 years (58%) and adults aged 85 or over (55%) were the least aware of this event compared to all other age classifications presented here.
- Disability Status: Non-disabled adults (68%) were more aware of the UEFA Women’s EURO 2022 event than disabled adults (66%).
Figure 11.2: Awareness of UEFA Women’s EURO 2022, by age and disability status, England: 2023/24. (Base: Adults in subsample of approximately a third of online respondents)

Figure 11.3 shows that in 2023/24:
- Sex: There were no differences in the level of awareness of the UEFA Women’s EURO 2022 event by sex.
- Gender identity: There were no differences observed between adults whose gender identity was the same as their sex registered at birth and adults who reported that their gender identity was different from their sex registered at birth.
- Sexual Orientation: Adults in the “other” sexual orientation classification (51%) were the least aware of the UEFA Women’s EURO 2022 event compared to all other sexual orientation classifications presented here (63–68%). Heterosexual or straight adults (68%) were more aware of this event than Gay or Lesbian adults (63%). There were no other differences observed between adults of different sexual orientation classifications presented here.
Figure 11.3: Awareness of UEFA Women’s EURO 2022, by sex[footnote 9], gender identity[footnote 10] and sexual orientation[footnote 11], England: 2023/24. (Base: Adults in subsample of approximately a third of online respondents)

Figure 11.4 shows that in 2023/24:
- Religion: Christian adults (71%) and non-religious adults (70%) were more aware of the UEFA Women’s EURO 2022 event than all other religious groups presented here (34–58%). Muslim adults (34%) were less aware of this event than all other religious groups presented here, with the exception of Hindu adults (38%). There were no other differences in awareness of this event between the religious groups presented here.
- Ethnicity: There was some variation in awareness of the UEFA Women’s EURO 2022 event for adults of different ethnic groups. For example, white British adults[footnote 17] (73%) were more aware of this event than all other ethnic groups presented here, with the exception of black Caribbean adults (68%).
Figure 11.4: Awareness of UEFA Women’s EURO 2022, by religion and ethnicity, England: 2023/24. (Base: Adults in subsample of approximately a third of online respondents)
Note: “Any other black, African, or Caribbean background” (H) ethnicity group is not shown due to the data being suppressed because fewer than 30 respondents selected this option.

| Bar label | Ethnicity | Bar label | Ethnicity | Bar label | Ethnicity |
|---|---|---|---|---|---|
| A | Bangladeshi | G | Caribbean | M | Arab |
| B | Chinese | H | Any other black, African, or Caribbean background | N | Any other ethnic group |
| C | Indian | I | Mixed white and Asian | O | English, Welsh, Scottish, Northern Irish, or British |
| D | Pakistani | J | Mixed white and black African | P | Gypsy or Irish Traveller |
| E | Any other Asian background | K | Mixed white and black Caribbean | Q | Irish |
| F | African | L | Any other multi-ethnic background | R | Any other white background |
Figure 11.5 shows that:
- Socio-economic classification: Adults from the higher managerial, administrative and professional occupations classification (72%) were more aware of the UEFA Women’s EURO 2022 event than adults in all other classifications presented here (49–69%), whilst adults from adults in the never worked or long-term unemployed classification (49%) were the least aware of the event. There were no other differences in awareness of this event between the socio-economic classifications presented here.
- Index of Multiple Deprivation (IMD): Adults from the lowest two deciles (the most deprived) (56% and 58%) were less aware of the UEFA Women’s EURO 2022 event than adults from all other deprivation deciles presented here. There were also some other variations; for instance, adults from the highest two decile (the least deprived) (73–74%) were more aware of this event than adults from all other deprivation deciles presented here, with the exception of adults from the seventh and eighth deciles (72–73%).
Figure 11.5: Awareness of UEFA Women’s EURO 2022, by socio-economic classification[footnote 12] and Index of Multiple Deprivation[footnote 13], England: 2023/24 (Base: Adults in subsample of approximately a third of online respondents)

| Bar label | Socio-Economic Classification |
|---|---|
| A | Higher managerial, administrative, and professional occupations |
| B | Intermediate occupations |
| C | Routine and manual occupations |
| D | Never worked and long-term unemployed |
Geographical findings
Figure 11.6 shows that adults from the South East (71%), South West (69%) and East of England (69%) regions were all more likely to be aware of the UEFA Women’s EURO 2022 event than the average for England as a whole (67%), whereas, adults from London (60%) region were the least likely to be aware of the event than the average for England as a whole (67%).
There was a lot of variation in the proportion of adults from different ITL2 regions who were aware of the event.
- Adults from Cheshire (73%), North Yorkshire (73%), Cumbria (73%), Kent (72%), Hampshire and Isle of Wight (72%), Herefordshire (71%), Worcestershire and Warwickshire (71%), Bedfordshire and Hertfordshire (71%), Berkshire, Buckinghamshire and Oxfordshire (70%) and Surrey, East and West Sussex (69%) ITL2 regions were more likely to be aware of the event than adults in England as a whole (67%).
- Adults from West Yorkshire (62%) , Outer London – East and North East (61%), Outer London – West and North West (60%), West Midlands (59%), Inner London – West (57%) and Inner London – East (56%) ITL2 regions were less likely to be aware of the event than adults in England as a whole (67%).
Figure 11.6: Awareness of the UEFA Women’s EURO 2022, by ITL2 region (county), England: 2023/24 (Base: Adults in subsample of approximately a third of online respondents)

12. Rugby League World Cup 2022
Respondents were asked about their awareness of the “Rugby League World Cup 2022” major event. These questions were asked to a subsample of approximately a third of online respondents, so the results may be affected due to only respondents who are already using the internet responding to these questions.
Headline findings
During May 2023 to March 2024 (2023/24): 55% of respondents were aware of the Rugby League World Cup 2022.
Of those adults who were aware of the Rugby League World Cup 2022, around a quarter of adults actually participated in the event (24%)[footnote 25]. Of these respondents who participated in the event, Figure 12.1 shows that:
- 93% followed coverage on TV or radio (including watching the event and/or news about the event)
- Around a quarter (26%) followed this event on social media
- Only 5% attended a local event.
Figure 12.1: Participation in Rugby League World Cup 2022 events, England: 2023/24 (Base: All adults that participated in the event)

Who is aware of the Rugby League World Cup 2022?[footnote 8]
Figure 12.2 shows that in 2023/24:
- Age: There was some variation in awareness of the Rugby League World Cup 2022 event between different aged classifications presented here. For example, adults aged 50 to 79 (59–62%) were more aware of this event compared to adults aged 49 and below (44–53%).
- Disability Status: Non-disabled adults (56%) were more aware of the Rugby League World Cup 2022 event compared to disabled adults (53%).
Figure 12.2: Awareness of the Rugby League World Cup 2022, by age and disability status, England: 2023/24. (Base: Adults in subsample of approximately a third of online respondents)

Figure 12.3 shows that in 2023/24:
- Sex: Male adults (58%) were more aware of the Rugby League World Cup 2022 event than female adults (52%).
- Gender identity: There were no differences observed between adults whose gender identity was the same as their sex registered at birth and adults who reported that their gender identity was different from their sex registered at birth.
- Sexual Orientation: Adults in the “other” sexual orientation classification (40%) were the least aware of the Rugby League World Cup 2022 event compared to all other sexual orientation classifications presented here (52–56%). Heterosexual or straight adults (56%) were more aware of this event than Gay or Lesbian adults (52%). There were no other differences observed between adults of different sexual orientation classifications presented here.
Figure 12.3: Awareness of the Rugby League World Cup 2022, by sex[footnote 9], gender identity[footnote 10] and sexual orientation[footnote 11], England: 2023/24. (Base: Adults in subsample of approximately a third of online respondents)

Figure 12.4 shows that:
- Religion: Christian adults (59%) and non-religious (57%) were more aware of the Rugby League World Cup 2022 event than all other religious groups presented here (22–47%). Muslim adults (22%) were less aware of this event than all other religious groups presented here (29–59%). Jewish adults (47%) and Buddhist adults (44%) were more aware of this event than Hindu adults (29%). There were no other differences in awareness of this event between the religious groups presented here.
- Ethnicity: There was some variation in awareness of the Rugby League World Cup 2022 event for adults of different ethnic groups. For example, white British adults[footnote 17] (61%) were more aware of this event than all other ethnic groups presented here, with the exception of black Caribbean adults (54%) and adults from the “other” mixed or multiple ethnic background (52%).
Figure 12.4: Awareness of the Rugby League World Cup 2022, by religion and ethnicity, England: 2023/24. (Base: Adults in subsample of approximately a third of online respondents)
Note: “Any other black, African, or Caribbean background” (H) ethnicity group is not shown due to the data being suppressed because fewer than 30 respondents selected this option.

| Bar label | Ethnicity | Bar label | Ethnicity | Bar label | Ethnicity |
|---|---|---|---|---|---|
| A | Bangladeshi | G | Caribbean | M | Arab |
| B | Chinese | H | Any other black, African, or Caribbean background | N | Any other ethnic group |
| C | Indian | I | Mixed white and Asian | O | English, Welsh, Scottish, Northern Irish, or British |
| D | Pakistani | J | Mixed white and black African | P | Gypsy or Irish Traveller |
| E | Any other Asian background | K | Mixed white and black Caribbean | Q | Irish |
| F | African | L | Any other multi-ethnic background | R | Any other white background |
Figure 12.5 shows that:
- Socio-economic classification: Adults from the higher managerial, administrative and professional occupations classification (60%) were more aware of the Rugby League World Cup 2022 event than adults in all other classifications presented here (39–56%), whilst adults from adults in the never worked or long-term unemployed classification (39%) were the least aware of the event. There were no other differences in awareness of this event between the socio-economic classifications presented here.
- Index of Multiple Deprivation (IMD): Adults from the lowest two deciles (the most deprived) (44% and 46%) were less aware of the Rugby League World Cup 2022 event than adults from all other deprivation deciles presented here. There were also some other variations; for instance, adults from the highest three decile (the least deprived) (61–62%) were more aware of this event than adults from all other deprivation deciles presented here, with the exception of adults from the seventh decile (60%).
Figure 12.5: Awareness of the Rugby League World Cup 2022, by socio-economic classification[footnote 12] and Index of Multiple Deprivation[footnote 13] England: 2023/24 (Base: Adults in subsample of approximately a third of online respondents)

| Bar label | Socio-Economic Classification |
|---|---|
| A | Higher managerial, administrative, and professional occupations |
| B | Intermediate occupations |
| C | Routine and manual occupations |
| D | Never worked and long-term unemployed |
Geographical findings
Figure 12.6 shows that adults from the South West (61%) and South East (58%) regions were all more likely to be aware of the Rugby League World Cup 2022 event than the average for England as a whole (55%), whereas, adults from London (46%) region were the least likely to be aware of the event than the average for England as a whole (55%).
There was a lot of variation in the proportion of adults from different ITL2 regions who were aware of the event.
-
Adults from Devon (62%), North Yorkshire (62%), Cumbria (61%), Gloucestershire, Wiltshire and Bristol/Bath area (61%), Dorset and Somerset (60%), Cornwall and Isles of Scilly (60%), Cheshire (59%), Herefordshire, Worcestershire and Warwickshire (59%), Kent (59%), Hampshire and Isle of Wight (58%), Berkshire, Buckinghamshire and Oxfordshire (58%), East Anglia (58%) and Surrey, East and West Sussex (58%) ITL2 regions were more likely to be aware of the event than adults in England as a whole (55%).
-
Adults from Outer London – East and North East (48%), Inner London – West (46%), West Midlands (46%), Outer London – West and North West (44%), Inner London – East (42%) ITL2 regions were less likely to be aware of the event than adults in England as a whole (55%).
Figure 12.6: Awareness of the Rugby League World Cup 2022, by ITL2 region (county), England: 2023/24 (Base: Adults in subsample of approximately a third of online respondents)

13. Use of the internet and ownership of smart devices
All respondents were asked whether they used the internet and how frequently they did this. Questions about smart devices were asked to a subsample of approximately a third of online respondents, so the results may be affected due to only respondents who are already using the internet responding to these questions.
Headline findings
During May 2023 to March 2024 (2023/24) internet usage remained high in England with 92.7% of adults using it, although this was a small 0.6 percentage point decrease from 2022/23 (93.2%).
Around half of adults in England accessed the internet almost all the time (49%), 41% many times a day, and 10% used it less frequently than that. Only 1% accessed it less frequently than several times a week.
- The most common internet speed was “more than 24Mbps, but up to 100Mbps” (27%) and the most common cost for internet access was between £21 to £30 per month (27%).
- Only 5% of adults had internet speeds of 1Gbps or more (gigabit speeds), and 15% of adults were paying more than £60 per month for their internet.
- High proportions of adults would not be willing to pay any more to either double their internet speed (53%), or to have gigabit speeds (51%).
During May 2023 to March 2024 (2023/24) only 0.5% of adults do not own either a smartphone, laptop computer, desktop PC, tablet, smart printer, smart TV, or games console.
Figure 13.1 shows the proportions of adults who reported they used the internet either at home or elsewhere in 2022/23 and 2023/24.
Figure 13.1: Internet usage, England: 2022/23 – 2023/24 (Base: All adults)

Figure 13.2 compares the proportions of adults who owned smart devices which were presented in separate lists in the survey. Between 2022/23 and 2023/24 there were small but significant increases in ownership of devices from both lists (0.2% increase for list 1 and 2.6% increase for list 2).
Figure 13.2: Ownership of any type of smart devices, England: 2023/24 (Base: Adults in subsample of approximately a third of online respondents)

Figure 13.3 ranks the prevalence of the types of smart devices personally owned or have at home.
- 93% of adults in England personally owned or used a smartphone at home, with a laptop computer being the second most owned or used digital device (63%). Only 0.5% of adults did not personally own a device on the list provided in the upper half of Figure 13.3.
- Of those with smart devices that were personally owned and used at home, 97% of adults owned a Wi-Fi router or internet hub. Only 1% of adults did not personally own and use at home a device on the list provided in the lower half of Figure 13.3.
Figure 13.3: Smart devices personally owned, England: 2023/24 (Base: Adults in subsample of approximately a third of online respondents)

The most common number of smart devices owned by a household was between 1 and 3 (43%), with the second most common range being between 4 and 6 (29%). Half of adults in England (50%) do not own a smartwatch or smart wristband, the other half own at least one.
Who used the internet?[footnote 8]
Figure 13.4 shows:
- Age: There were no differences between 16–59 years old adults with approximately 98% using the internet. However, for adults in the over 60 years old age groups (41–96%), internet usage fell. Adults aged 85 or above (41%) were less likely to use the internet than adults aged 60–84 years old (59–96%).
- Disability Status: Non-disabled adults were more likely to use the internet (95%) than disabled adults (87%).
Figure 13.4: Use of the internet, by age and disability status, England: 2023/24. (Base: All adults)

Figure 13.5 shows:
- Sex: There were no differences in the level of internet usage by sex (93%).
- Gender identity: A greater proportion of adults whose gender identity was the same as their sex registered at birth (93%) used the internet than adults who reported that their gender identity was different from their sex registered at birth (90%).
- Sexual Orientation: Heterosexual or straight adults (97%), gay or lesbian adults (98%), and bisexual adults (98%) used the internet more than adults in the “other” sexual orientation classification (90%).
Figure 13.5: Use of the internet, by sex[footnote 9], gender identity[footnote 10] and sexual orientation[footnote 11], England: 2023/24. (Base: All adults)

Figure 13.6 shows:
- Religion: Adults of no religion (97%) used the internet more than all other religious categories presented here, except Buddhist adults (95%). Buddhist (95%), Hindu (93%), Muslim (93%) adults, and adults of any “other” religion category (94%) used the internet more than Christian (89%), Jewish adults (91%) and Sikh adults (88%).
- Ethnicity: Internet usage for adults of different ethnic groups were mostly evenly distributed. However, Gypsy or Irish Traveller adults were the least likely to use the internet (64%) than all other ethnic groups presented here.
Figure 13.6: Use of the internet, by religion and ethnicity, England: 2023/24. (Base: All adults)

| Bar label | Ethnicity | Bar label | Ethnicity | Bar label | Ethnicity |
|---|---|---|---|---|---|
| A | Bangladeshi | G | Caribbean | M | Arab |
| B | Chinese | H | Any other black, African, or Caribbean background | N | Any other ethnic group |
| C | Indian | I | Mixed white and Asian | O | English, Welsh, Scottish, Northern Irish, or British |
| D | Pakistani | J | Mixed white and black African | P | Gypsy or Irish Traveller |
| E | Any other Asian background | K | Mixed white and black Caribbean | Q | Irish |
| F | African | L | Any other multi-ethnic background | R | Any other white background |
Figure 13.7 shows:
- Socio-economic classification: There was a general trend that all of the socio-economic classifications were different from each other, with adults from the higher managerial, administrative and professional occupations classification having the highest internet use (97%), followed by adults from the intermediate occupations classification (94%), followed by adults from the routine or manual occupations classification (89%) and adults from the never worked and long term unemployed classification (78%) used the internet the least.
- Index of Multiple Deprivation (IMD): Adults from the lowest two deciles (the most deprived) (88% and 89%) were less likely to use the internet than adults from all other deciles (93% to 95%).
Figure 13.7: Use of the internet, by socio-economic classification[footnote 12] and Index of Multiple Deprivation[footnote 13], England: 2023/24 (Base: All adults)

| Bar label | Socio-Economic Classification |
|---|---|
| A | Higher managerial, administrative, and professional occupations |
| B | Intermediate occupations |
| C | Routine and manual occupations |
| D | Never worked and long-term unemployed |
Geographical findings
Figure 13.8 shows that compared with the England average (93%), adults in London (95%) were more likely to use the internet. Adults in the South East (94%) and East of England (94%) were slightly more likely to use the internet than the England average. Of 296 LAs, 77% are not different to the England average, with 11% above and 12% below, although some of these differences are small but significant. In general, the patterns of usage at the regional level are also observed at the local authority (LA) level. There are a few exceptions:
-
In the East of England (94%) where usage was slightly higher than the England average, Luton (88%), Tendring (89%), and Great Yarmouth (89%), and King’s Lynn and West Norfolk (89%) local authorities were lower.
-
In the West Midlands (91%) and East Midlands (92%) where usage was lower than the England average, Stafford (96%), Derbyshire Dales (97%) and Harborough (96%) local authorities were higher.
Figure 13.8: Use of the internet, Local Authority[footnote 14][footnote 15], England: 2023/24 (Base: All adults)
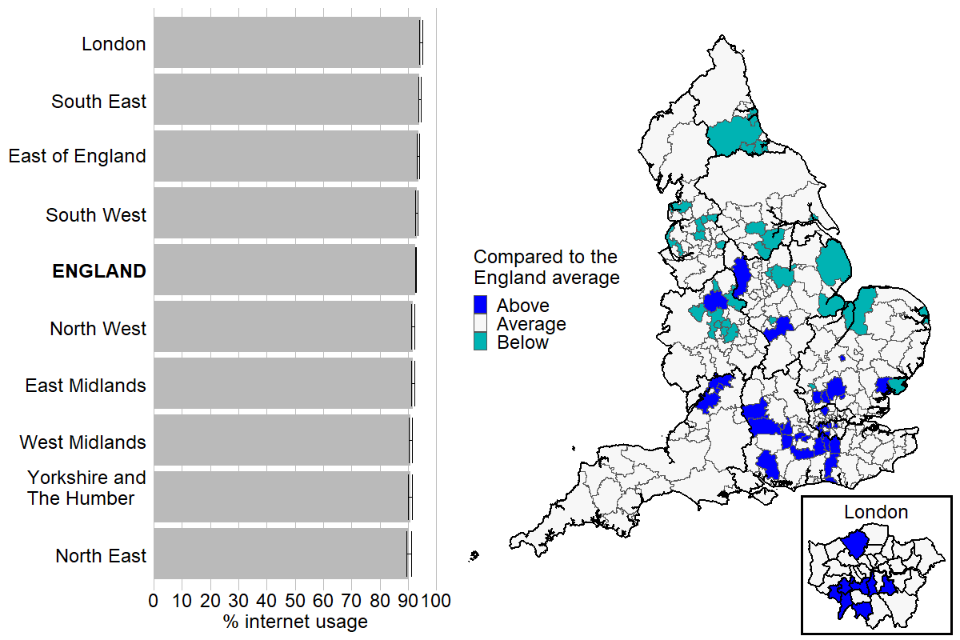
14. 5G (Fifth generation)
5G (Fifth generation) is the next step in mobile technology that enables faster mobile data speeds. The questionnaire asked a series of questions about the respondents’ awareness and likelihood to use 5G in the near future. These questions were asked to a subsample of approximately a third of online respondents, so the results may be affected due to only respondents who are already using the internet responding to these questions.
Headline findings
During May 2023 to March 2024 (2023/24) 28% of adults reported that they have heard of and already use 5G.
Of adults asked “how much do you know about 5G mobile technology”, Figure 14.1 shows:
- 5% had not heard of 5G, a 1 percentage point decrease compared to 2022/23 (6%)
- 28% had heard of it and already use it[footnote 26]
- 17% had heard of it but were not sure what it is, a 4 percentage point decrease from 2022/23 (21%)
- 18% understood 5G but were not interested in getting it in the near future, a 13 percentage point decrease from 2022/23 (31%)
- 33% reported that they understood what it is and were interested in getting it in the near future, an 8 percentage point decrease from 2022/23 (41%)
Figure 14.1: 5G awareness, England: 2023/24 (Base: Adults in subsample of approximately a third of online respondents)

The 18% of adults who understood 5G but were not interested in getting it in the near future were shown the statements in Figure 14.2 and asked to pick all that applied.
- Over half of adults (57%) reported they were happy with their current mobile internet speeds so would not be willing to pay more for 5G.
- Over two-fifth of adults would get 5G if it were free (42%).
- Of the 8% of adults who would pay more for 5G if they really thought they would benefit:
- 25% would not be willing to pay any more than their current mobile data plan
- 21% would be willing to pay up to £2 more than their current mobile data plan
- 27% would be willing to pay more than £2, up to £5, more than their current mobile data plan.
Figure 14.2: Attitudes towards getting 5G, England: 2023/24 (Base: Adults who understood 5G but were not interested in getting it in the near future)

Who has heard of 5G?[footnote 8]
- Age: Under the age of 75, between 2% to 5% of adults had not heard of 5G. Over the age of 74, there was a sharp increase in the proportion of adults who have not heard of 5G, 9% for the age group 75 to 79 years old and 22% for the age group 85 or over. Adults aged between 20 and 54 years old were most likely to have heard of and already use 5G (30–36%). The age pattern for adults who have heard of 5G but are not sure what it is and for adults who understand what 5G is but are not interested in getting it in the near future is similar. Adults aged 16 to 19 were more likely to have heard of 5G but not sure what it is than those aged 20 to 49. For adults over the age of 74 years old (24–28%), the likelihood of having heard of 5G but not sure what it is was higher than other age groups. For adults over the age of 65 years old (25–32%), the proportion who understand what 5G is but are not interested in getting it in the near future was higher than all other age groups. Between the ages of 16 to 64 years old, the proportion of adults who reported that they have heard of 5G and are interested in getting it in the near future was similar (31–39%), although a slight trend downwards was apparent from the age of 35 years old or over, dropping to the lowest levels for adults aged 80 or over (14–16%).
- Disability Status: Non-disabled adults were more likely to already use 5G (30%) and to have heard of it and are interested in getting it in the near future (35%) than disabled adults (23% and 30% respectively). Disabled adults were more likely to have not heard of 5G (6%), were more likely to have heard but not know what 5G is (20%), and were more likely to know what 5G is but are not interested in getting it in the near future (21%), than non-disabled adults.
- Sex: Female adults were more likely to have not heard of 5G (5%), and were more likely to have heard of 5G but not understand what it is (22%) than male adults (4% and 11% respectively). Male adults were more likely to have heard of 5G and already use it (30%), and were more likely to know what 5G is and be interested in getting it in the near future (38%) than female adults (27% and 28% respectively). There were no differences observed between male and female adults who understand what 5G is but are not interested in getting it in the near future.
- Gender identity: There were no differences in the awareness of and attitude towards 5G between adults whose gender identity was the same as their sex registered at birth and adults who reported that their gender identity was different from their sex registered at birth.
- Sexual Orientation: Adults in the “other” sexual orientation classification (6%) and heterosexual or straight adults (4%) were more likely to have not heard of 5G than gay or lesbian adults (2%) and bisexual adults (2%). Gay and lesbian adults (11%) were the least likely to have heard of 5G and be not sure of what it is. There were no other differences between adults of the sexual orientation classifications presented here in their awareness of and attitude towards 5G .
- Religion: There was a lot of variation in the awareness of and attitude to 5G of adults from different religions. For instance, non-religious adults were more likely to already use 5G (30%) and to have heard of it and are interested in getting it in the near future (36%) than Christian adults (26% and 31% respectively).
- Ethnicity: There was a lot of variation in the awareness of and attitude to 5G of adults from different ethnic groups. For instance, adults from any other Asian background (37%), black African (38%), and black Caribbean (35%) ethnic groups, were more likely to have heard of 5G and already use it than white British adults[footnote 17] (27%).
- Socio-economic classification: Adults in the higher managerial, administrative and professional occupations classification, were more likely to already use 5G (30%) and to have heard of it and are interested in getting it in the near future (36%) than adults in all other socio-economic classifications. Adults in the never worked and long-term unemployed classification were more likely to have not heard of 5G (10%), and were more likely to know what 5G is but are not interested in getting it in the near future (23%), than adults in the higher managerial, administrative and professional occupations classification (16%). Adults in the higher managerial, administrative and professional occupations classification were the least likely to have heard of 5G but don’t know what it is (15%), than adults in all other socio-economic classifications.
- Index of Multiple Deprivation (IMD): There was some variability among adults of different deprivation deciles in their awareness and attitude towards using 5G. For instance, fewer adults in the most deprived areas (1st decile) (30%) understand what 5G is and are interested in getting it in the near future than adults from the two least deprived areas ( 9th and 10th deciles) (both 35%).
15. Digital or Online skills training
Respondents were asked between May 2023 and March 2024 whether they had taken part in any digital or online skills training[footnote 27] in the last 12 months prior to being asked. These questions were asked to a subsample of approximately a third of online respondents, so the results may be affected due to only respondents who are already using the internet responding to these questions.
Headline findings
As shown in Figure 15.1, during May 2023 to March 2024 (2023/24): 36%
of adults who use the internet in England had taken part in digital skills training in the previous 12 months, a 14 percentage point increase[footnote 28] from 2022/23 (22%)
Figure 15.1: Engagement with digital or online skills training, England: 2022/23 – 2023/24 (Base: Adults in subsample of approximately a third of online respondents and use the internet)

Over half of adults thought it was important to continue digital or online skills training in their current career or job (56%) and a similar proportion thought developing digital or online skills was important to helping them further career or job prospects (57%).
Figure 15.2 shows that 27% of adults would be interested in doing training in digital skills, whereas the majority would not.
Figure 15.2 Interest in doing any training in digital or online skills, England, 2023/24. (Base: Adults who did not do training in digital or online skills in the last 12 months)

Figure 15.3 shows that 75% of adults thought that it was important for them to continue digital or online skills training to help with their day-to-day activities, whereas 25% thought it was not important.
Figure 15.3: Attitudes towards doing training in digital or online skills to help with day-to-day activities, England: 2023/24. (Base: Adults in subsample of approximately a third of online respondents)

Who has undertaken training in digital or online skills ?[footnote 8]
Figure 15.4 shows that in 2023/24:
- Age: Adults between the ages of 20 and 54 years old were more likely to have done training in digital or online skills (45–48%) than all other age groups presented here. Adults aged 16–19 years old (32%) and adults aged 60–64 (30%) were similarly likely to have undertaken training in digital or online skills. For adults over the age of 54 years old, their engagement with training decreases steadily, from 40% for the age group 55–59 years old, to 5% for adults aged 80 or over.
- Disability Status: Non-disabled adults were more likely to engage (39%) in training in digital or online skills than disabled adults (29%).
Figure 15.4: Engagement with training in digital or online skills, by age and disability status, England: 2023/24. (Base: Adults in subsample of approximately a third of online respondents)

Figure 15.5 shows that in 2023/24:
- Sex: Male adults were more likely to engage (37%) in training in digital or online skills than female adults (35%).
- Gender identity: There were no differences observed between adults whose gender identity was the same as their sex registered at birth and adults who reported that their gender identity was different from their sex registered at birth.
- Sexual Orientation: Heterosexual or straight adults were least likely to engage (36%) in training in digital or online skills than all other sexual orientation classifications presented here. There were no other differences observed between adults of different sexual orientation classifications presented here.
Figure 15.5: Engagement with digital or online skills training, by sex[footnote 9], gender identity[footnote 10] and sexual orientation[footnote 11], England: 2023/24. (Base: Adults in subsample of approximately a third of online respondents)

Figure 15.6 shows that:
- Religion: There was a lot of variation in engagement with training in digital or online skills for adults of different religious groups. For instance, Hindu adults (48%) were more likely to have taken training in digital or online skills than Christian (33%), Jewish (35%), Muslim (36%), and adults of no religion (38%).
- Ethnicity: There was a lot of variation in engagement with training in digital or online skills for adults of different ethnic groups. For instance, adults from the Chinese (36%), black African (50%), mixed white and black African (50%), any other white background (46%), or any other ethnic group backgrounds (43%) were more engaged than white British adults[footnote 17] (34%).
Figure 15.6: Engagement with digital or online skills training, by religion and ethnicity, England: 2023/24. (Base: Adults in subsample of approximately a third of online respondents)
Note: “Any other black, African, or Caribbean background” (H) ethnicity group is not shown due to the data being suppressed because fewer than 30 respondents selected this option.

| Bar label | Ethnicity | Bar label | Ethnicity | Bar label | Ethnicity |
|---|---|---|---|---|---|
| A | Bangladeshi | G | Caribbean | M | Arab |
| B | Chinese | H | Any other black, African, or Caribbean background | N | Any other ethnic group |
| C | Indian | I | Mixed white and Asian | O | English, Welsh, Scottish, Northern Irish, or British |
| D | Pakistani | J | Mixed white and black African | P | Gypsy or Irish Traveller |
| E | Any other Asian background | K | Mixed white and black Caribbean | Q | Irish |
| F | African | L | Any other multi-ethnic background | R | Any other white background |
Figure 15.7 shows that:
- Socio-economic classification: Adults from the higher managerial, administrative and professional occupations classification (45%) were more likely to have taken training in digital or online skills than adults from intermediate occupations. Adults from intermediate occupations (31%) were more likely to have taken training than adults from routine and manual occupations (28%), who were more likely to have taken training than adults from the never worked and long-term unemployed classification (14%).
- Index of Multiple Deprivation (IMD): There was little variation observed in engagement with training in digital or online skills for adults between the deprivation deciles, although adults in the most deprived decile (33%) were slightly less likely to have taken training in digital or online skills than adults in the 2nd (37%) and 6th (37%) deciles.
Figure 15.7: Engagement with digital or online skills training, by socio-economic classification[footnote 12] and Index of Multiple Deprivation[footnote 13], England: 2023/24 (Base: Adults in subsample of approximately a third of online respondents)

| Bar label | Socio-Economic Classification |
|---|---|
| A | Higher managerial, administrative, and professional occupations |
| B | Intermediate occupations |
| C | Routine and manual occupations |
| D | Never worked and long-term unemployed |
Geographical findings
Figure 15.8 shows that adults in London (40%) were more likely than the England average (36%) to have taken training in digital or online skills, whereas adults in Yorkshire and The Humber (33%) region were less likely to have done so.
Within ITL2 (county) regions, West and North West Outer London (41%), Inner London East (43%) and Berkshire, Buckinghamshire and Oxfordshire (41%) ITL2 regions were more likely to engage with digital or online skills training than the England average. Conversely, adults in Cumbria (31%), East Yorkshire and Northern Lincolnshire (31%) and North Yorkshire (31%) ITL2 regions engaged less than the England average.
Figure 15.8: Engagement with digital or online skills training, by regions and counties, England: 2023/24 (Base: Adults in subsample of approximately a third of online respondents)
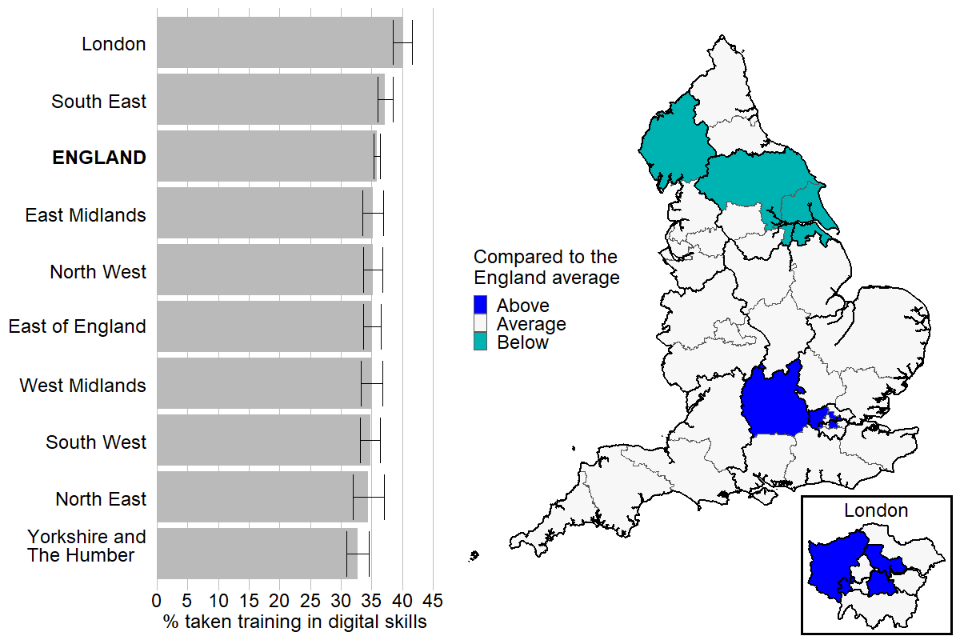
16. Security online
Respondents were asked questions on the measures they took to stay safe and secure online and while using digital technology, and they were also asked to consider statements relating to their understanding of the security of personal data. These questions were asked to a subsample of approximately a third of online respondents, so the results may be affected due to only respondents who are already using the internet responding to these questions.
Headline findings
Between May 2023 to March 2024 (2023/24), adults in England were generally aware of the measures to stay safe and secure online.
Figure 16.1: Measures taken to stay safe and secure online, England: 2023/24 (Base: Adults in subsample of approximately a third of online respondents)

Figure 16.2 shows that of the list of measures presented in the survey related to staying safe and secure while using technology (which may or may not have internet access), the action most adults (65%) took was to create strong passwords that are not easy to guess. Also, over half of adults:
- Created different passwords for different devices or accounts (56%)
- Allowed computer systems and security software to be updated when prompted (52%)
- Backed up their information or content frequently (51%)
However, 8% of respondents reported they did none of the measures on the list given
Figure 16.2: Measures taken to stay safe and secure while using technology, England: 2023/24 (Base: Adults in subsample of approximately a third of online respondents)

In the 12 months previous to being surveyed, of the list of actions in Figure 16.3:
- 63% of adults made payments online using a credit card or payment platform.
- 46% of adults checked website or seller review before making a payment online
- 8% of adults protected their emails with three random words[footnote 29]
- 16% of adults did none of the things of the measures on the list given
Figure 16.3: Actions taken to protect data and online security in the last 12 months, England: 2023/24 (Base: Adults in subsample of approximately a third of online respondents)

17. Methods of identification
Respondents were asked about the methods they had used to verify their own identity online, for example, when applying for a passport or applying for a new benefit or new job. They were also asked about their preference between verifying their identity digitally or with hard copy documents for different activities, for example, opening a bank account or travelling. These questions were asked to a subsample of approximately a third of online respondents, so the results may be affected due to only respondents who are already using the internet responding to these questions.
Headline findings
Figure 17.1 shows that in 2023/24, nearly two-fifth of adults in England, 38% had provided personal information (such as passport number or date of birth) to verify their identity online, a 7 percentage point decrease from 2022/23 (45%)
44% of adults had not verified their own identity online in the last 12 months, a 5 percentage point increase from 2022/23 (39%)
Figure 17.1: Methods used to verify identity online, England: 2022/23 – 2023/24 (Base: Adults in subsample of approximately a third of online respondents)

Figure 17.2 shows that in general, adults preferred to use digital tools for identification than using hard/physical copies for things such as:
- Opening a bank account (46% digital versus 34% physical).
- Travelling (44% digital versus 34% physical).
- Starting a new job (41% digital versus 29% physical).
- Accessing benefits (39% digital versus 26% physical).
Figure 17.2: Preference of methods to verify identity, England: 2023/24

A digital identity is an electronic representation of a person and information about them, such as their name, address, date of birth and qualifications. It enables them to prove who they are during interactions and transactions online or in person. These checks can be done digitally, by identity service providers.
Figure 17.3 shows that over four fifths of adults thought these factors were important when choosing a company or agency to processing their digital identify:
- The level of support offered to complete the identity check (87%),
- Whether it was endorsed by the government (83%),
- Whether they had heard of the company or agency (85%),
- The length of time it would take for the identity check to be completed (85%).
For each of the factors, more adults answered “Don’t know” (8% to 9%) than “not very important” and “not at all important” combined (5% to 7%).
Figure 17.3 Importance of factors when choosing a company or agency for processing one’s digital identity, England, 2023/24. (Base: Adults in subsample of approximately a third of online respondents)

18. Use of data
Respondents were asked about their views on how data is used by different parts of society, and for their understanding and actions around cookies. Data here is used to mean information about people, systems as well as objects. These questions were asked to a subsample of approximately a third of online respondents, so the results may be affected due to only respondents who are already using the internet responding to these questions.
Headline findings
In general, adults in England during May 2023 and March 2024 (2023/24) were more comfortable with the government and businesses using data to make and implement better decisions and to deliver services, than using data for administrative purposes or to uncover patterns and trends.
Figure 18.1 shows that adults in England during May 2023 and March 2024 (2023/24) reported similar levels of comfort when they thought about how businesses and government used the data they collected to deliver services.
- 18% reported “very comfortable” for both
- 47% reported “fairly comfortable” for both
- 14% reported “fairly uncomfortable” for both
- 11% reported “don’t know” for both
- 11% reported “very uncomfortable” for the government using data to deliver services, a higher proportion than those who reported “very uncomfortable” for businesses using data to deliver services (10%).
Figure 18.1: How comfortable adults felt about the UK government or private companies using data, England: 2023/24 (Base: Adults in subsample of approximately a third of online respondents)

Cookies are small pieces of information that websites leave on your device, usually to help the website remember information about you. A cookie pop-up is a notification that is displayed on websites to ask visitors for consent for the use of cookies. Figure 18.2 shows that:
- 56% of adults accept all cookies on most websites when a cookie pop-up is displayed.
- Just over a fifth of adults (22%) reject all cookies,
- Just under a fifth of adults (18%) customise their cookie choices.
Figure 18.2: What adults do when a cookie pop-up is displayed on most websites, England: 2023/24. (Base: Adults in subsample of approximately a third of online respondents)

Related to this, 31% of adults agreed that website cookie pop-ups help them control access to their personal data, whereas 34% neither agreed or disagreed, and 26% disagreed.
When it came to sharing data,
- A majority of adults (42% agree and 15% strongly agree) would share their medical history or allergies with government organisations if it helped develop new medicines or treatments. Lesser proportions would agree to share the same with businesses (37% agree and 13% strongly agree).
- Over two-fifth of adults (44%) agreed they would share data about their online activity if it were used to monitor crime and protect them from harm, while 27% disagreed.
- Almost two-fifths of adults (39%) would share data about their spending habits if it would allow them to gain access to services that could save them money, while 31% would not share.
Annex 1
-
The Participation survey is commissioned by the Department for Culture, Media and Sport (DCMS). In February 2023, there was a Machinery of Government (MoG) change and responsibility for digital policy now sits within the Department for Science, Innovation and Technology (DSIT). DCMS continues to run the digital policy sections of the Participation Survey on behalf of DSIT.
-
The fieldwork for the Participation survey has been conducted by Verian (Formerly Kantar Public) since October 2021.
-
This release is based on self-completed questionnaires conducted either online or using paper questionnaires. The survey was completed between May 2023 to March 2024. The total sample size for this survey year was 171,748. Sample sizes for each breakdown can be found in the accompanying tables.
-
All households sampled were invited to complete the survey online with the option to request a paper questionnaire instead. A targeted sample was also sent two paper questionnaires in their second reminder letter to encourage responses from those at risk of digital exclusion. In May 2023 to March 2024, 149,273 people (87%) completed the survey online and 21,975 (13%) completed the paper version of the questionnaire. Due to space limitations in the paper questionnaire, not all questions from the online survey are included in the paper version and the source of each survey measure is therefore referenced in the accompanying tables. Please take this into consideration when interpreting the results.
-
The Participation Survey represents a set of Official Statistics and as such has been produced to the professional standards set out in the Code of Practice for Statistics. Official Statistics undergo regular quality assurance reviews to ensure they meet customer needs and are produced free from any political interference. Please see the UK Statistics Authority’s Code of Practice for more information.
-
Stringent quality assurance procedures have been adopted for this statistical release. All data and analysis had been checked and verified by at least two different members of the DCMS team and Verian to ensure the highest level of quality.
-
Guidance on the quality that is expected of Participation Survey statistical releases is provided in a quality indicators document. These quality indicators outline how statistics from the Participation survey match up to the six dimensions of quality defined by the European Statistical System (ESS). These are: relevance, accuracy, timeliness, accessibility, comparability, and coherence.
-
The Participation Survey measures participation by adults (aged 16 and over) living in private households in England. No geographical restriction is placed on where the activity or event occurred.
-
Unless stated, participation in activities must be for the purpose of recreation or leisure, including voluntary work. It excludes involvement in activities where the prime motivation is paid work or academic studies.
-
Changes over time and differences between groups are only reported on where they are statistically significant at the 95% level. Statistically significant differences have been determined in this report on the basis of non-overlapping confidence intervals. This means that we can be confident that the differences seen in our sampled respondents are reflective of the population. Specifically, the statistical tests used mean we can be confident that if we carried out the same survey on different random samples of the population, 95 times out of 100 we would get similar findings. When sample sizes are smaller, we can be less confident in our estimates, so differences need to be greater to be considered statistically significant.
-
The upper and lower bounds presented in this report have been calculated using a 95% confidence interval. This means that had the sample been conducted 100 times, creating 100 confidence intervals, then 95 of these intervals would contain the true value. When the sample size is smaller, as is the case for certain groups and in certain years, the confidence intervals are wider as we can be less certain that the individuals in the sample are representative of the population. This means that it is more difficult to draw inferences from the results.
-
The data is weighted to ensure representativeness of the Participation Survey sample. Weighting is based on January-March 2023 Labour Force Survey data from the Office for National Statistics for quarter one, April-June 2023 for quarters two and three, and October-December 2023 for quarter four. There are two types of weighting: (i) to compensate for unequal probabilities of selection, (ii) to adjust for non-response. Detailed information on the weighting procedure can be found in the Technical Note.
-
The GSS has a policy of monitoring and reducing statistical survey burden to participants where possible, and the burden imposed should be proportionate to the benefits arising from the use of the statistics. As a producer of statistics, DCMS is transparent in its approach to monitoring and reducing the burden on those providing their information, and on those involved in collecting, recording and supplying data. The compliance cost of a survey is calculated by [Number of responses to the survey multiplied by the median time spent completing the survey (in minutes)]. The Participation Survey had 171,748 respondents in May 2023 to April 2024, and the median survey completion time was 25 minutes 34 seconds, therefore the compliance cost for the survey this year was 73,183 hours, 43 minutes and 52 seconds.
-
The Participation Survey is only asked of adults in England. Currently there is no harmonised survey or set of questions within the administrations of the UK. Data on participation in cultural sectors for the devolved administrations is available in the Scottish Household Survey, National Survey for Wales and Northern Ireland Continuous Household Survey.
-
For more information about the Participation survey and to access other guidance documents and the questionnaire, see the Participation Survey web pages.
-
The responsible statisticians for this release are Donilia Asgill and Ella Bentin. For enquiries on this release, please contact ParticipationSurvey@dcms.gov.uk.
Annex 2
| Term | Definition |
|---|---|
| Arts | A list of activities that are classified as engagement with the arts is given in Annex 3 |
| Attended an art event in person, or participated in an art activity in person, or watched online an arts event covered by ACE’s policy remit | Arts Council England (ACE) is the national development agency for creativity and culture. They invest in artists, arts organisations, museums and libraries, and provide development opportunities for this sector. A list of activities included within the survey that are classified as attendance, participation or watching arts events or activities covered by ACE’s policy remit is given in Annex 3. |
| City of Culture Bradford 2025 | UK City of Culture is a competition run by the Department for Culture, Media and Sport (DCMS) every four years. The next City of Culture will be in Bradford in 2025. |
| Confidence interval | A confidence interval provides a range in which there is a specific probability that the true value for the population will fall. For the Participation Survey 95% confidence intervals are used which means, had the sampling been conducted 100 times, creating 100 confidence intervals, then 95 of these intervals would contain the true value for adults in England. |
| Coronation of His Majesty The King | The Coronation of His Majesty the King took place on May 6th 2023. |
| Coventry City of Culture | UK City of Culture is a competition run by the Department for Culture, Media and Sport (DCMS) every four years. The UK City of Culture started in May 2021 in Coventry and ended in May 2022. |
| Data | Information about people, things and systems. Information about people could include things like their names and addresses or it could be about the population, like the proportion of adults who own a property. Information about systems includes how companies perform, like hospital waiting times or company sales figures. Information about things might include the stock of food at a supermarket or the number of ventilators at a hospital. |
| DCMS and DSIT Sectors | The DCMS sectors referred to in this report are; arts, heritage, museums and galleries, libraries, tourism, major events and live sport.The DSIT sectors referred to in this report are; digital and internet, 5G, digital or online skills training, data security, methods of identification, data security, use of data and data sharing.Prior to February 2023, all of these sectors were classified as DCMS sectors, but following Machinery of Government changes, the digital sectors are the responsibility of DSIT. |
| Digital engagement | Digital engagement in each sector is defined as visiting a website or using an app related to that sector. |
| Digital or online skills training | The Participation Survey asks whether respondents had taken part in any digital or online skills training. This might include training in how to carry out basic functions such as using digital or online applications to communicate and carry out basic internet searches and to stay safe online. |
| Disability | The harmonised question for disability status: 1. Respondents that said ‘yes’ to the question “Do you have any physical or mental health conditions or illnesses lasting or expected to last 12 months or more?” and 2. Respondents that said ‘Yes a little’ or ‘Yes, a lot’ to the question “Does your condition or illness/do any of your conditions or illnesses reduce your ability to carry-out day-to-day activities?” |
| Domestic Tourism | Holidays (that is, staying at least one night away from your home) in England was counted as tourism within the Participation Survey. |
| Engagement | This refers to either attending and/or participating in one of DCMS’ and ACE’s sectors, either in person or online, for example, going to the theatre (attendance) or playing a musical instrument (participation). |
| Ethnic groups | The Participation Survey respondents were asked to self-identify in terms of ethnicity. The options follow the harmonised question for ethnicity. |
| Gambling | The Participation Survey captures information on respondents placing bets during sporting events. |
| Gender Identity | The Participation Survey respondents were asked the question “Is the Sex you identify with the same as your Sex registered at birth?”. The response options were ‘Yes’, ‘No (type in Gender identity)’ and ‘Prefer not to Say’. This follows the harmonised question for gender identity. |
| Heritage | A list of activities that are classified as engagement with heritage is given in Annex 3. |
| Index of Multiple Deprivation (IMD) | IMD is a geographical measure which classifies the relative deprivation of an area. It combines 7 indices to produce one overall measure for the area (rather than the individual). It takes into account income, employment, education, skills and training, health and disability, crime, barriers to housing and services, and living environment. |
| International Territorial Levels (ITLs) | ITLs are a UK geographical classification of administrative areas, used by OECD member countries for statistical purposes. In England, the Participation Survey covers: 1. ITL 1 (Regions): there are 9 regions, for example, North West England, or London. 2. ITL 2 (Counties and groups of counties): there are 33 county regions, for example, East Yorkshire and Northern Lincolnshire, or Outer London – East and North East |
| Local Authority (LA) level | As of 1st April 2023, there are 296 LA districts in England, for example, Kent County Council or London Borough of Camden. |
| Libraries | The list of activities that are classified as public library use is given in Annex 3. |
| Live sports | Watching sport as it is being played in real time. |
| Museums and galleries | A list of activities that are classified as engagement with museums and galleries is given in Annex 3. |
| Physical engagement | Engaging with DCMS and ACE sectors in-person, that is, not using digital means. |
| Religion | The Participation Survey respondents were asked to self-identify themselves in terms of religious beliefs. The options follow the harmonised question for religion, and are based on affiliation (rather than belief or practice). |
| Sex | The Participation Survey respondents were asked the question “What is your Sex?”. The response options were ‘Male’, ‘Female’ and ‘Prefer not to Say’. This closely follows the ONS Census 2021 in England, Wales, and Northern Ireland question for Sex designed to capture Sex at birth, but has slightly been amended to include a ‘prefer not to say’ option as we do for all questions in the Participation Survey. This question is followed by a gender identity question. |
| Sexual orientation | The Participation Survey respondents were asked “Which of the following options best describes how you think of yourself?”. The options were Heterosexual or Straight, Gay or Lesbian, Bisexual, Other, or prefer not to say, following the harmonised question for sexual orientation designed to capture ‘self-perceived sexual identity’. |
| Router/internet hub | A router is a device that communicates between the internet and the devices in your home that connect to the internet. |
| Significant increase/decrease | A significant increase/decrease at the 95% level means that if we carried out the same survey on different random samples of the population, 95 times out of 100 we would observe the increase/decrease. |
| Smart device | Smart products are devices or appliances controlled via an internet connection. |
| Socio-economic group (NS-SEC) | NS-SEC is a form of socio-economic classification based on the employment status and occupation of the respondent. The individual is placed within one of the three socio-economic groups: 1. Higher managerial, administrative and professional occupations 2. Intermediate occupations 3. Routine and manual occupations. There is a fourth category “never worked and long-term unemployed”, which also encompasses adult students. |
| UEFA Women’s EURO 2022 | The UEFA (Union of European Football Associations) Women’s EURO 2022 took place in July 2022. |
| Wellbeing | Estimates of life satisfaction, feeling that the things done in life are worthwhile, happiness and anxiety. |
| 5G | 5G stands for fifth generation. It is the next step in mobile technology. It offers faster mobile internet speeds. |
Annex 3
As a result of the DCMS and ACE partnership, we have a more granular dataset on adult engagement in DCMS sectors. This led to the inclusion of new questions and changes to existing questions, response options and definitions in the 2023/24 survey. The questionnaire for 2023/24 has been developed collaboratively to adapt to the needs and interests of both DCMS and ACE. For reference, the previous year’s cultural definitions can be found in Annex 3 of the 2022/23 Participation Survey Annual Report.
Arts
The respondent was asked whether they had participated in a given list of arts activities, or attended a given list of arts events (not including paid work, school or college or structured academic activities). Eligible activities and events were as follows:
Physical participation:
- written stories, plays, or poetry
- read books or magazines
- written or performed music
- painting, drawing, printmaking, calligraphy
- crafts (textile, ceramic, sculpting, carving, woodwork)
- choreographed or performed a drama or dance routine
- designed or programmed video games including on a smartphone or tablet
- played video games including on a smartphone or tablet
- made films or videos as a hobby including original animations
- photography as a hobby
- other arts, crafts, or creative activities at home
Physical attendance:
- An exhibition of art, photography or sculptures
- A theatre play, drama, musical, Pantomime, Ballet or Opera
- An event connected with literature, books, reading, poetry reading or writing
- A cinema screening of a film or movie
- A craft exhibition (not a crafts market; crafts include for example textiles, woodworking)
- A live music event (for example, pop, jazz, electronic, choral, orchestra or folk)
- An arts festival and or carnival (for example, a food, craft or other cultural event)
- A street art event
- A live dance event (for example, contemporary, world, street or urban)
- A fashion show
- A comedy event
- An in-person esports contest or video game competition event
- Some other cultural event in England
Digital engagement:
- a live arts event including theatre, visual arts or literature
- a pre-recorded arts event including theatre, visual arts or literature
- a live music or dance event, watched as it was happening
- a pre-recorded music or dance event
Attendance, participation or watching arts events or activities covered by ACE’s policy remit
Arts Council England is the national development agency for creativity and culture. They invest in artists, arts organisations, museums and libraries, and provide development opportunities for this sector[footnote 6]. Options within the survey which would fall within this remit include:
Attendance:
- An exhibition of art, photography or sculptures
- A theatre play, drama, musical, Pantomime, Ballet or Opera
- An event connected with literature, books, reading, poetry reading or writing
- A craft exhibition
- A live music event
- An arts festival and or carnival
- A street art event
- A live dance event
Participation:
- Written stories, plays, or poetry
- Written, practiced or performed music
- Painting, drawing, printmaking, calligraphy, colouring
- Crafts
- Choreographed or performed a drama or dance routine
- Photography as a hobby
Watched online:
- A live arts event including theatre, visual arts or literature
- A pre-recorded arts event including theatre, visual arts or literature
- A live music or dance event, watched as it was happening
- A pre-recorded music or dance event
Libraries
Physical engagement:
Respondents were asked in which of these ways have you used public library services? (not including paid work, school or structured academic activities).
- Visited a public library building or mobile library in-person in my leisure time
- Visited by a home library service
- Used another library outreach services (for example attended a community event where the library staff or volunteers were present)
Digital engagement:
The respondent was asked whether they had done any of the following things when accessing library services online (not including paid work, school or college or structured academic activities):
- Reserved or renewed books or paid a fine
- Searched online catalogues or dictionaries or made an enquiry
- Borrowed digital or online resources such as e-books, e-audio or e-magazines but without visiting the library
- Viewed or participated in an online event or activity organised by the library
- Checked information online about the library such as opening hours, available facilities or services offered
- Accessed online services via library membership such as journals or family history sites
- Accessed some other library service online.
Heritage
Physical engagement:
The respondent was asked whether they had visited any of the following historic places in person (not including paid work, school or college or structured academic activities). By historic we mean a place of exceptional cultural or heritage value:
- A city or town that you visited specifically for its historic nature
- A historic, non-religious building open to the public
- A historic place of worship attended as a visitor (not to worship)
- A park or garden open to the public with historic or artistic features
- A place connected with industrial history (such as an old factory, mine or railway)
- An ancient monument or archaeological site (such as a castle, fort, burial site)
- A site connected with sports visited for its heritage
- A site connected with maritime or underwater heritage (such as shipwrecks)
- A historic landscape or habitat (such as coastline, countryside)
- Some other heritage site or historic place
Digital engagement:
The respondent was asked which of these virtual or online activities they had done (not including paid work, school or college or structured academic activities):
- taken a virtual walking tour of a historic town or city, heritage site, castle or monument in England (Not including drone flights)
- researched your local history online
- viewed documents from an archive in England online
- engaged with text, image, audio, video, or animation, games, or podcast content from heritage sites in England
Museums and galleries
Physical engagement:
The respondents were asked if they had visited a museum or gallery in person in England in the last 12 months.
Digital engagement:
The respondent was asked which of these virtual or online activities they had done (not including paid work, school or college or structured academic activities):
- taken a virtual tour of a museum or gallery in England
- researched items from a museum or gallery collection in England online
- engaged with text, image, audio, video, or animation, games, or podcast content from museums in England
Annex 4
The questionnaire has been produced as a result of a series of engagements with ACE, key stakeholders and the social survey needs of DCMS sectors. We have worked closely with Verian to devise a clear and effective questionnaire to acquire data for DCMS and ACE policy teams.
There is some overlap with questions observed in the Taking Part Survey, however we advise not to compare findings from these two different surveys. For more information on the distinction between the Taking Part Survey and the Participation Survey please look in the methodology documents on the website.
-
In February 2023, there was a Machinery of Government change and responsibility for digital policy now sits within the Department for Science, Innovation and Technology. This will not affect the content of the Participation Survey for 2023/24 and 2024/25; digital questions are still part of the survey. ↩
-
Where possible in this report, demographic breakdowns are provided for age, sex, gender identity, disability status, socio-economic classification, ethnicity, religion, Sexual orientation, Index of Multiple Deprivation and for ITL1, ITL2 and Local Authority regions. We have reported findings based on a single demographic rather than the intersection of multiple demographics. It is therefore possible that similar trends are seen in multiple demographics, for instance people in ethnic minority groups tend to be younger on average than white British people and are more likely to live in urban areas, although we have not tested this hypothesis within the Participation Survey data. ↩
-
The 95% confidence intervals are indicated by error bars on the charts. They show the range that we are 95% confident the true value for the population falls between. When there is no overlap between the error bars for two or more groups, we can be more confident that the differences between groups represent true differences between these groups in the population. ↩
-
The definition of engagement with the arts, libraries and heritage has been changed in the 2023/24 questionnaire compared to the 2022/23 and 2021/22 questionnaires. This is to be more inclusive of current ways of engagement. The full list of qualifying activities and events we asked about are in Annex 3. ↩ ↩2 ↩3
-
The most frequent level at which adults attended any arts event or participated in any arts activity in person. As in, if a respondent engaged in three types of activities “Less often than once a month but at least 3 or 4 times a year”, and in a fourth activity “Less often than once a week but at least once a month”, then that person’s frequency of engagement is counted as once a month. ↩
-
ACE’s remit also covers engagement with Libraries and Museums and Galleries. Data on these are covered in Chapter 3 and Chapter 5 of this report. ↩ ↩2
-
The figure for adults that watched an art event covered by ACE’s policy remit online in the last 12 months is the same definition used for the DCMS digital arts engagement. These figures are therefore the same (36%). ↩
-
Demographic questions in the survey were voluntary and self-reported by the respondent. ↩ ↩2 ↩3 ↩4 ↩5 ↩6 ↩7 ↩8 ↩9 ↩10 ↩11 ↩12 ↩13
-
This data is based on the respondent’s sex. The Participation Survey respondents were asked the question “What is your sex?”. The response options were ‘Male’, ‘Female’ and ‘Prefer not to Say’. This closely follows the ONS Census 2021 in England, Wales, and Northern Ireland question for sex designed to capture sex at birth, but has slightly been amended to include a ‘prefer not to say’ option as we do for all questions in the Participation Survey. In the 2022/23 questionnaire, a custom gender question was asked “Would you describe yourself as…” with the following options ‘Male’, ‘Female’, ‘Prefer to self-describe’ and ‘Prefer not to say’. Comparisons between 2023/24 and previous years by gender are therefore not possible. ↩ ↩2 ↩3 ↩4 ↩5 ↩6 ↩7 ↩8 ↩9 ↩10 ↩11 ↩12 ↩13
-
A question on the respondent’s gender identity was asked in the 2023/24 survey for the first time. Respondents were asked “Is the gender you identify with the same as your sex registered at birth?”, with the possible responses being ‘Yes’, ‘No, type in gender identity’ or ‘Prefer not to say’.
Patterns were identified in Census 2021 data that suggest that some respondents may not have interpreted the gender identity question as intended, notably those with lower levels of English language proficiency. Analysis of Scotland’s census, where the gender identity question was different, has added weight to this observation. More information can be found in the ONS sexual orientation and gender identity quality information report, and in the National Statistical blog about the strengths and limitations of gender identity statistics. ↩ ↩2 ↩3 ↩4 ↩5 ↩6 ↩7 ↩8 ↩9 ↩10 ↩11 ↩12 ↩13
-
Sexual orientation is an umbrella concept which encompasses gender identity, attraction and behaviour. The question asked in the Participation Survey follows the harmonised standard based on a substantial body of research designed to capture self-perceived gender identity. ↩ ↩2 ↩3 ↩4 ↩5 ↩6 ↩7 ↩8 ↩9 ↩10 ↩11 ↩12 ↩13
-
This is a form of socio-economic classification based on the employment status and occupation of the respondent. ↩ ↩2 ↩3 ↩4 ↩5 ↩6 ↩7 ↩8 ↩9 ↩10 ↩11 ↩12 ↩13
-
The Index of Multiple Deprivation is a geographical measure which classifies the relative deprivation of an area. It combines seven indices to produce one overall measure for the area (rather than the individual). It takes into account income, employment, education, skills and training, health and disability, crime, barriers to housing and services, and living environment. ↩ ↩2 ↩3 ↩4 ↩5 ↩6 ↩7 ↩8 ↩9 ↩10 ↩11 ↩12 ↩13
-
The full list of Local authority engagement figures can be found in the published annual data tables. ↩ ↩2 ↩3 ↩4 ↩5 ↩6 ↩7 ↩8 ↩9
-
The 2023/24 Participation Survey collects over 170,000 responses, so confidence intervals are generally very narrow. Whilst this reflects a strength of the data, when highlighting differences, some local authorities may be shown to be above/below the England average, but are only a percentage point more/ less than the average. There will be other local authorities who are much more above or below the England average, but will both be shown in the same shading within the map. ↩ ↩2 ↩3 ↩4 ↩5 ↩6 ↩7 ↩8 ↩9
-
The most frequent level at which adults engaged with libraries physically. As in, if a respondent engaged in three types of activities “Less often than once a month but at least 3 or 4 times a year”, and in a fourth activity “Less often than once a week but at least once a month”, then that person’s frequency of engagement is counted as once a month. ↩
-
The white British ethnic group relates to bar O in the bar chart and includes adults from an English, Welsh, Scottish, Northern Irish or British ethnic group. ↩ ↩2 ↩3 ↩4 ↩5 ↩6 ↩7 ↩8 ↩9 ↩10 ↩11 ↩12
-
The total heritage engagement (physical or digital) figure and figure for engaging in heritage, both physically and digitally are only available for quarters 3 and 4 (Oct 2023 to Mar 2024). ↩
-
The total heritage engagement (physical or digital) figure and figure for engaging in heritage both physically and digitally are only available for quarters 3 and 4 (Oct 2023 to Mar 2024). The physical engagement and digital engagement figures are based on all four quarters in 2023/24 (May 2023 to March 2024). ↩ ↩2
-
The physical engagement and digital engagement figures are based on all four quarters in 2023/24 (May 2023 to March 2024). ↩
-
The most frequent level at which adults engaged with heritage physically or digitally. As in, if a respondent engaged in three types of activities “Less often than once a month but at least 3 or 4 times a year”, and in a fourth activity “Less often than once a week but at least once a month”, then that person’s frequency of engagement is counted as once a month. ↩
-
The most frequent level at which adults engaged with museums and galleries physically. As in, if a respondent engaged in three types of activities “Less often than once a month but at least 3 or 4 times a year”, and in a fourth activity “Less often than once a week but at least once a month”, then that person’s frequency of engagement is counted as once a month. ↩
-
Any sport except men’s football, women’s football, rugby, tennis, cricket, athletics, golf, snooker, swimming and gymnastics. ↩
-
In the 2023/24 questionnaire there are separate options for men’s and women’s football. However, in previous years there was no differentiation between men’s and women’s football, and therefore a figure for football combined was presented. ↩
-
Respondents were asked which major events they had participated in. This was only asked to respondents reporting that they had heard of the event when asked either during or after the event had taken place. ↩ ↩2 ↩3 ↩4
-
Respondents were asked ‘how much do you know about 5G mobile technology’.This response option was only collected in 23/24 and therefore comparisons are not possible with previous years ↩
-
This is training about digital or online skills rather than any other form of training online. This might include training in how to carry out basic functions such as using digital or online applications to communicate and carry out basic internet searches and to stay safe online. ↩
-
The digital skills question has been changed in the 2023/24 questionnaire compared to 2022/23 and 2021/22 to include a work specific option. Respondents were asked, ‘In the last 12 months, have you taken part in any digital or online skills training’. This now includes the response options: 1.Yes, as part of my work and 2.Yes, outside of work. In 2022/23 and 2021/22 respondents were asked ‘In the last 12 months, have you taken part in any digital or online skills training? 1. Yes 2. No’. Some of the increase observed in the percentage of respondents taking part in digital or online skills training between 2022/23 and 2023/24 may be attributed to this change in question structure”. ↩
-
Picking “Three random words” for passwords is the recommendation from the National Cyber Security Centre (NSCS). We have chosen to highlight this statistic because of the commonplace suggestions for web users to create passwords using random characters, symbols, and numbers. ↩