Section 4 – Trade
Updated 10 March 2025
1. Key Statistics - Trade
The UK is a net importer of fish. The UK’s crude trade gap (imports minus exports) in 2023 for sea fish is 274 thousand tonnes. This is smaller than 2022, where the gap was 316 thousand tonnes. In 2023 the UK imported 611 thousand tonnes of sea fish, with a value of £3.5 billion. It exported 336 thousand tonnes, with a value of £1.7 billion.
2. Section 4: Trade
View the tables accompanying this section here.
Data on trade is collected by trade weight. This differs to the measure of quantity used in previous sections which is live weight. MMO landings data is reported in terms of live weight which is the weight of the live fish caught from the sea. Trade weight is sometimes smaller if fish are processed further after landing (e.g. gutted or shelled) on board a ship prior to being exported.
Trade data are sourced from HM Revenue & Customs overseas trade statistics [25] which reports UK trade in goods (exports and imports). Data are reported on a physical movement basis, meaning the weight and value of the transaction is captured at the time the goods cross international borders, regardless of whether there has been any change in economic ownership of those goods. Value is presented in current prices, meaning no adjustment has been made to account for changes in inflation or exchange rates.
These data, and those published by HMRC, are not directly comparable with headline statistics for total UK trade published by the Office for National Statistics (ONS).
3. Imports and exports
Figure 4.1: Total imports and exports by the UK in 2023.

The UK’s trade gap (imports minus exports) in 2023 for sea fish was 274 thousand tonnes. The UK is a net importer of fish, with a higher volume of fish imported than exported. In 2023 the UK imported 611 thousand tonnes of fish [26], with a value of £3.5 billion. It exported 336 thousand tonnes. Compared to 2022, the crude trade gap decreased by 13%, as a result of a combination of a 6% increase in imports and a decrease in exports (down 2%) compared to 2022.
Figure 4.2: UK imports and exports of fish and fish products split by species in 2023.

4. Imports
Figure 4.3: Imports into the UK of fish and fish products by top 5 import markets in 2023.
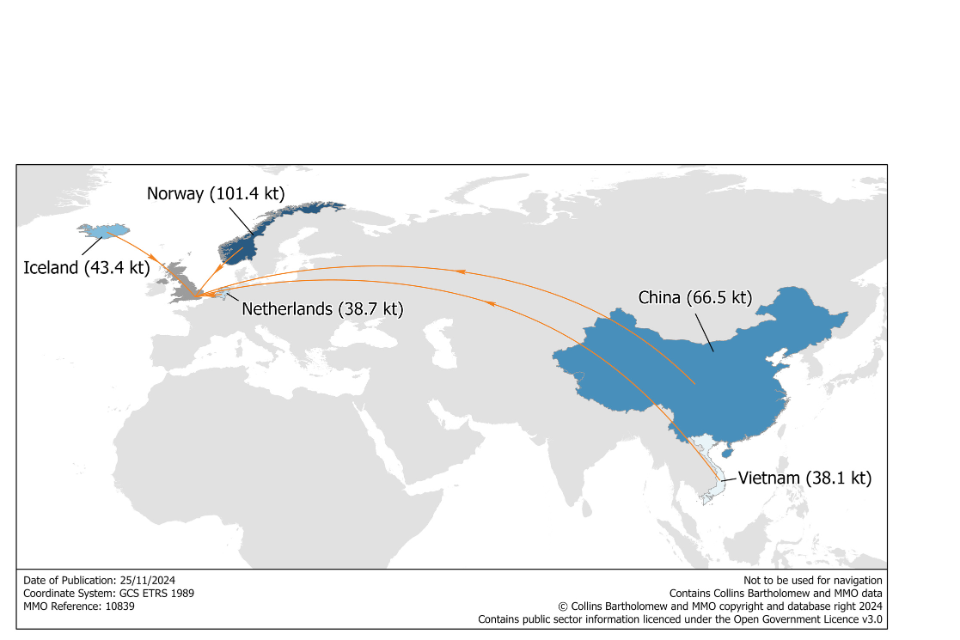
Norway was the country from which the UK imported the most fish and fish products in 2023. Demersal and pelagic fish accounted for 84% of fish imports into the UK by weight. Shellfish accounted for the remaining 16%. In terms of value imported, shellfish made up a slightly higher percentage at 21%, because of the higher price typically fetched by shellfish species [27].
The UK imported 133 thousand tonnes of fish products [28] in 2023, with most of which was fish meal (69%). This brings the total imports (including sea fish, freshwater fish and fish products) to 743 thousand tonnes.
Figure 4.4: Imports to the UK of cod by top 5 import markets in 2023.
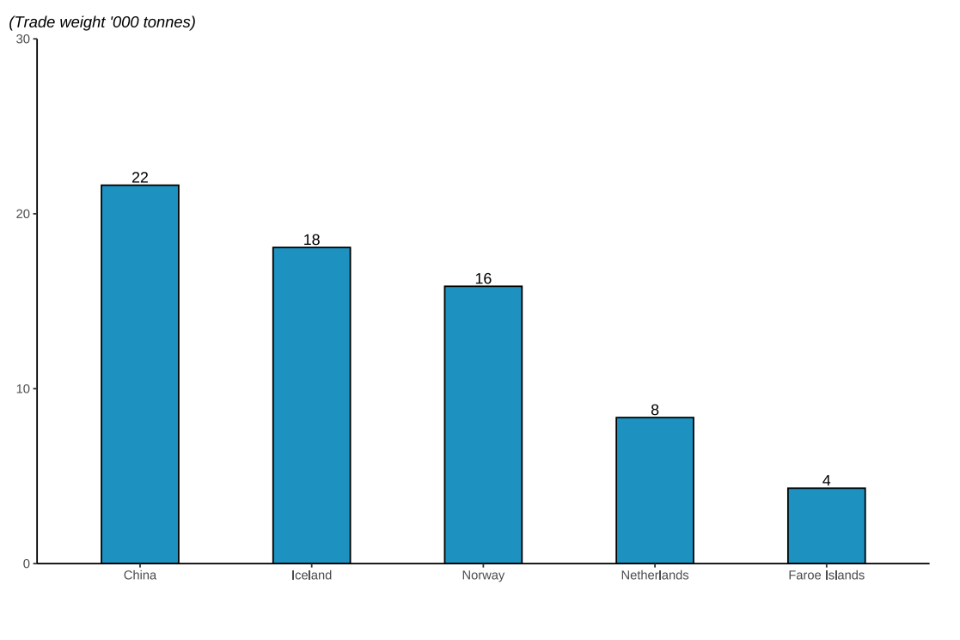
The UK is a net importer of cod, importing 78 thousand tonnes in 2023. The countries the UK imported the largest quantities of Cod from in 2023 were China (22 thousand tonnes), Iceland (18 thousand tonnes) and Norway (16 thousand tonnes). Imports from these 3 countries accounted for 71% of the total imports of Cod into the UK in 2023
Figure 4.5: Imports to the UK of tuna species by top 5 import markets in 2023.

The UK is a net importer of tuna, importing 93 thousand tonnes in 2023. The countries the UK imported the largest quantities of Tuna from in 2023 were Ecuador and Mauritius. Imports from Ecuador accounted for 26% of the total imports of Tuna into the UK in 2023.
Figure 4.6: Imports to the UK of shrimps and prawns by top 5 import markets in 2023.
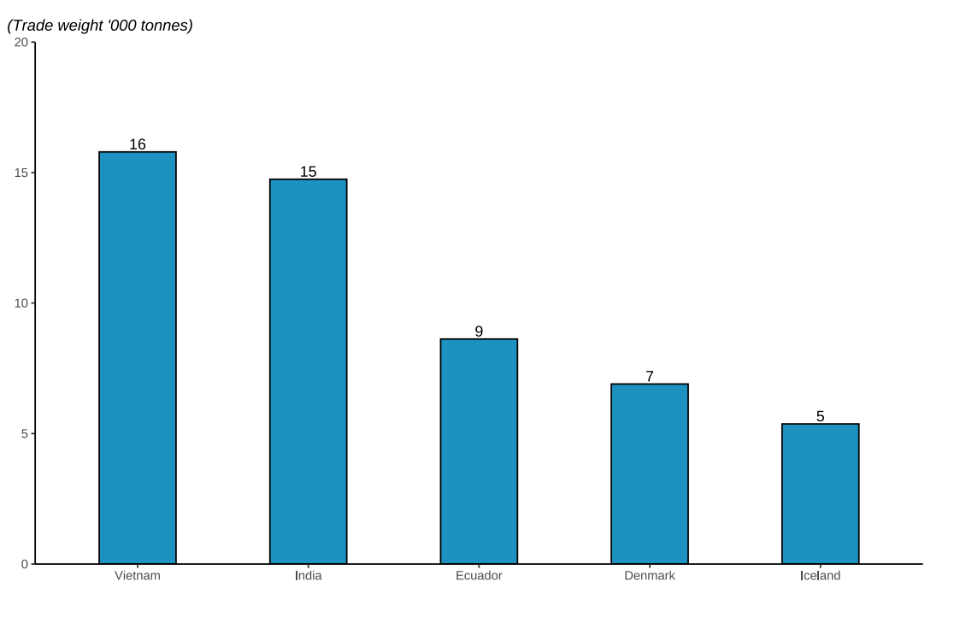
The UK is a net importer of shrimps and prawns, importing 73 thousand tonnes in 2023. The countries the UK imported the largest quantities of shrimps and prawns in 2023 were Vietnam (16 thousand tonnes) and India (15 thousand tonnes). Imports from these two countries accounted for 42% of the total imports of shrimps and prawns into the UK in 2023.
5. Exports
Figure 4.7: Exports from the UK of fish and fish products by top 5 export markets in 2023.
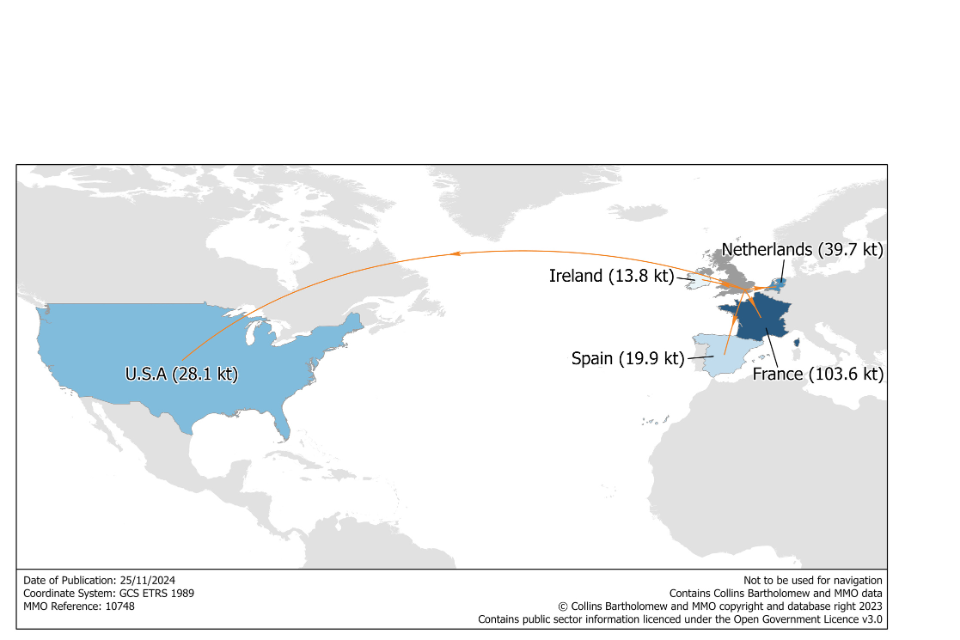
The UK exported the most fish and fish products to France in 2023. Demersal and pelagic fish accounted for 81% of fish exports out of the UK by weight with shellfish accounting for 19%. Shellfish similarly make up a higher percentage of the exports by value owing to their higher price per tonne on average than other sea fish (29%). The UK exported 11 thousand tonnes of fish products in 2023, bringing the total exports (including sea fish, freshwater fish and fish products) to 347 thousand tonnes.
Figure 4.8: Exports from the UK of Mackerel by top 5 export markets.
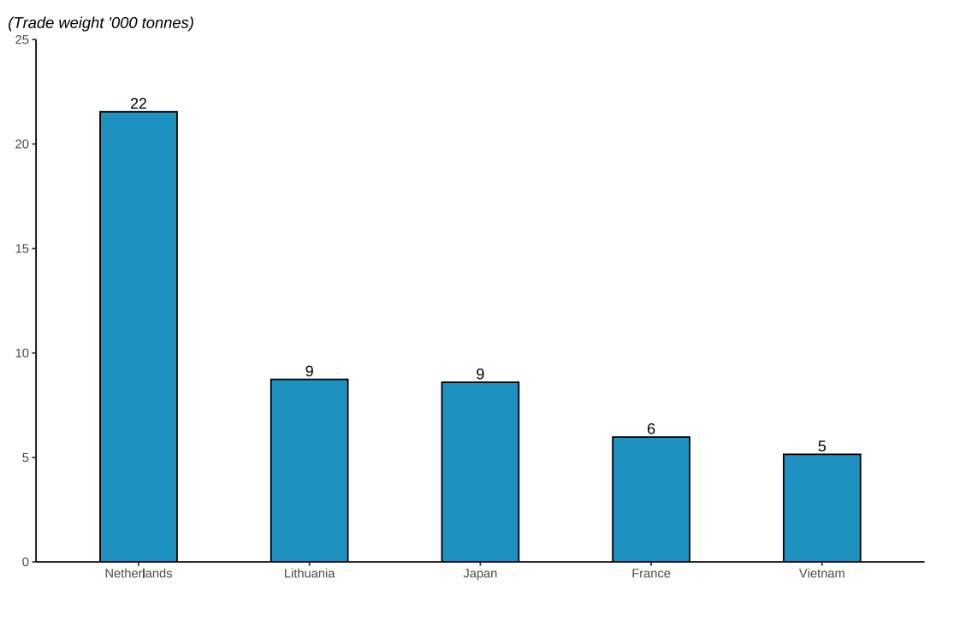
The UK is a net exporter of mackerel, exporting 75 thousand tonnes in 2023. Mackerel exports increased by 31% compared to 2022. The largest share of mackerel exports went to Netherlands (18 thousand tonnes).
6. GDP
GDP
Gross Domestic Product (GDP) is a standard measure of value added through the production of goods and services in a country. It is often used as a measure of the size or health of an economy.
GDP is the sum of the Gross Value Added (GVA) of each industry sector within a country.
GVA for fishing and aquaculture includes landings abroad by the UK fleet. Fishing and aquaculture is included in the wider agriculture, forestry and fishing sector group.
GVA is reported in current prices, meaning no adjustment has been made to account for changes in inflation over time.
The GVA for fishing and aquaculture in 2023 is £862 million, up 8% on a year earlier. The GVA for fishing comprises 5.7% of the total for agriculture, forestry and fishing [29] .
[25] UK Trade Info from HM Revenue & Customs.
[26] Excluding fish products.
[27] Table 2.12.
[28] Fish products includes e.g. fish meal and oils.
[29] GDP output approach – low-level aggregates - Office for National Statistics.
